Solana price started a downside correction from the 5 zone against the US Dollar. The price is now trading below 0 and the 55 simple moving average (4 hours). There was a break below a key bullish trend line with support at 0 on the 4-hour chart of the SOL/USD pair (data feed from Coinbase). The pair must stay above the 2 and 2 support levels to start another increase. Solana price is correcting gains from 5 against the US Dollar, like Bitcoin. SOL could start another increase if the bulls remain active above 2. Solana (SOL) Price Analysis SOL price attempted more upsides above the 0 resistance zone. The price climbed above the 0 zone, but the bears were active near the 5 zone. A high was formed near 4.25 before there was a
Topics:
Aayush Jindal considers the following as important: Altcoin News, News, sol, solana, Trading
This could be interesting, too:
Bitcoin Schweiz News writes Meme Coins frühzeitig entdecken: So gelingt der Einstieg vor dem Hype
Christian Mäder writes Bitpanda startet DeFi Wallet und öffnet die Tür zu Web3
Bitcoin Schweiz News writes Bitpanda vs. Binance: Welche Bitcoin-App ist die beste für die Schweiz?
Bitcoin Schweiz News writes OpenSea: Der Marktplatz für NFTs und digitale Sammlerstücke
- Solana price started a downside correction from the $205 zone against the US Dollar.
- The price is now trading below $190 and the 55 simple moving average (4 hours).
- There was a break below a key bullish trend line with support at $190 on the 4-hour chart of the SOL/USD pair (data feed from Coinbase).
- The pair must stay above the $172 and $162 support levels to start another increase.
Solana price is correcting gains from $205 against the US Dollar, like Bitcoin. SOL could start another increase if the bulls remain active above $162.
Solana (SOL) Price Analysis
SOL price attempted more upsides above the $190 resistance zone. The price climbed above the $200 zone, but the bears were active near the $205 zone.
A high was formed near $204.25 before there was a downside correction. The price declined below the $200 support zone. There was a break below a key bullish trend line with support at $190 on the 4-hour chart of the SOL/USD pair.
The bears were able to push the price below the 50% Fib retracement level of the upward wave from the $162 swing low to the $205 high. It is now trading below $190 and the 55 simple moving average (4 hours).
On the downside, initial support is near the $178 level and the 61.8% Fib retracement level of the upward wave from the $162 swing low to the $205 high. The next major support is near the $172 level. A downside break below the $172 support level might spark a sharp decline.
In the stated case, the price may perhaps decline toward the $162 level. Any more losses might call for a test of $150. On the upside, immediate resistance is near the $190 level. The next major resistance is near the $205 zone.
Any more gains might send SOL price toward the $225 resistance zone, above which the price could accelerate higher. The next major resistance sits near the $240 level.
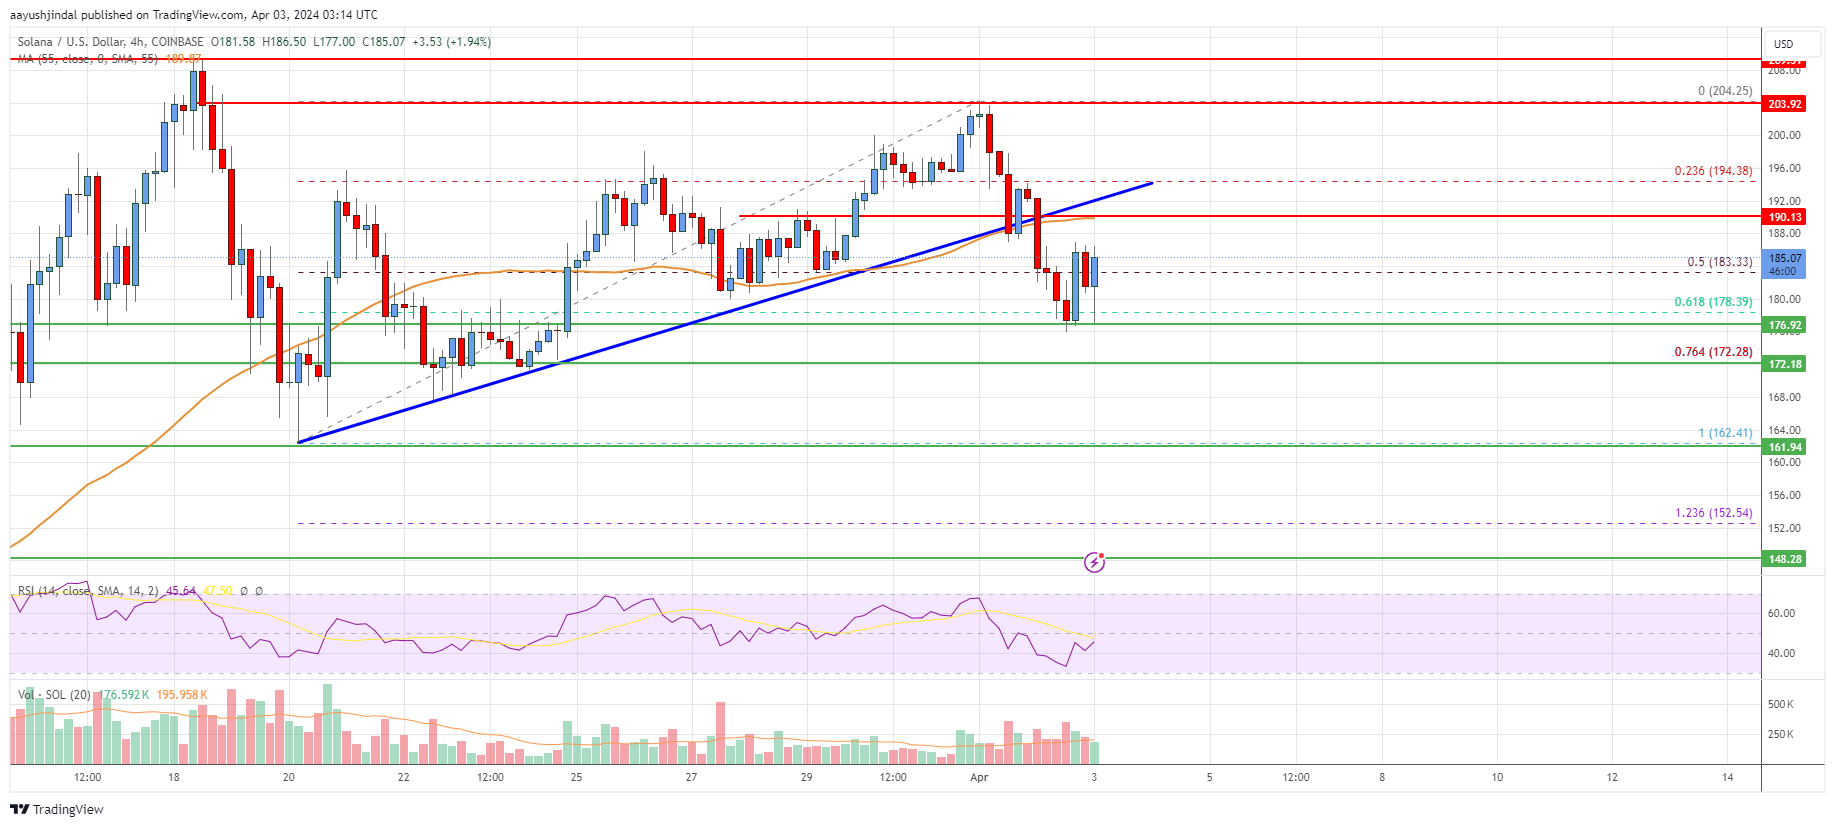
Looking at the chart, Solana price is clearly trading below $190 and the 55 simple moving average (4 hours). Overall, the price must stay above the $172 and $162 support levels to start another increase.
Technical Indicators
4 hours MACD – The MACD is now losing momentum in the bearish zone.
4 hours RSI (Relative Strength Index) – The RSI is now below the 50 level.
Key Support Levels – $172 and $162.
Key Resistance Levels – $190, $200, and $205.