Stellar lumen price is moving lower below the %excerpt%.1120 pivot level against the US Dollar. XLM price is now trading below %excerpt%.1100 and the 55 simple moving average (4 hours). There is a key bearish trend line forming with resistance near %excerpt%.1095 on the 4-hour chart (data feed via Kraken). The pair could extend its decline below the %excerpt%.1080 support zone in the near term. Stellar lumen price is trading below %excerpt%.1120 against the US Dollar, like Bitcoin. XLM price could extend losses if it trades below the %excerpt%.1080 support. Stellar Lumen Price Analysis (XLM to USD) In the past few sessions, Stellar Lumen price struggled to climb above the %excerpt%.1125 resistance against the US Dollar. The XLM/USD pair failed to continue higher and started a fresh decline. There was a
Topics:
Aayush Jindal considers the following as important: Altcoin News, News, Stellar Lumens, Trading, xlm
This could be interesting, too:
Bitcoin Schweiz News writes Meme Coins frühzeitig entdecken: So gelingt der Einstieg vor dem Hype
Bitcoin Schweiz News writes Bitpanda vs. Binance: Welche Bitcoin-App ist die beste für die Schweiz?
Bilal Hassan writes Morocco Cracks Down on Crypto Property Deals
Bilal Hassan writes Crypto Becomes a U.S. ‘Weapon,’ Says CryptoQuant CEO
- Stellar lumen price is moving lower below the $0.1120 pivot level against the US Dollar.
- XLM price is now trading below $0.1100 and the 55 simple moving average (4 hours).
- There is a key bearish trend line forming with resistance near $0.1095 on the 4-hour chart (data feed via Kraken).
- The pair could extend its decline below the $0.1080 support zone in the near term.
Stellar lumen price is trading below $0.1120 against the US Dollar, like Bitcoin. XLM price could extend losses if it trades below the $0.1080 support.
Stellar Lumen Price Analysis (XLM to USD)
In the past few sessions, Stellar Lumen price struggled to climb above the $0.1125 resistance against the US Dollar. The XLM/USD pair failed to continue higher and started a fresh decline.
There was a rejection pattern noticed near the 50% Fib retracement level of the downward move from the $0.1167 swing high to the $0.1080 low. The price declined and traded below the $0.1100 level. XLM is now trading below $0.1100 and the 55 simple moving average (4 hours).
Immediate resistance is near the $0.1100 level. There is also a key bearish trend line forming with resistance near $0.1095 on the 4-hour chart. The next key resistance is seen near the $0.1125 level. A clear upside break above the $0.1125 zone might send the price toward $0.1145.
The 76.4% Fib retracement level of the downward move from the $0.1167 swing high to the $0.1080 low is also near the $0.1145 level. Any more gains could lead the price toward the $0.1165 level.
If not, the price might continue to move down. Initial support on the downside is near the $0.1080 level. The next major support is $0.1050. Any more losses could lead the price toward the $0.1000 level in the near term, below which the price might even test $0.0950.
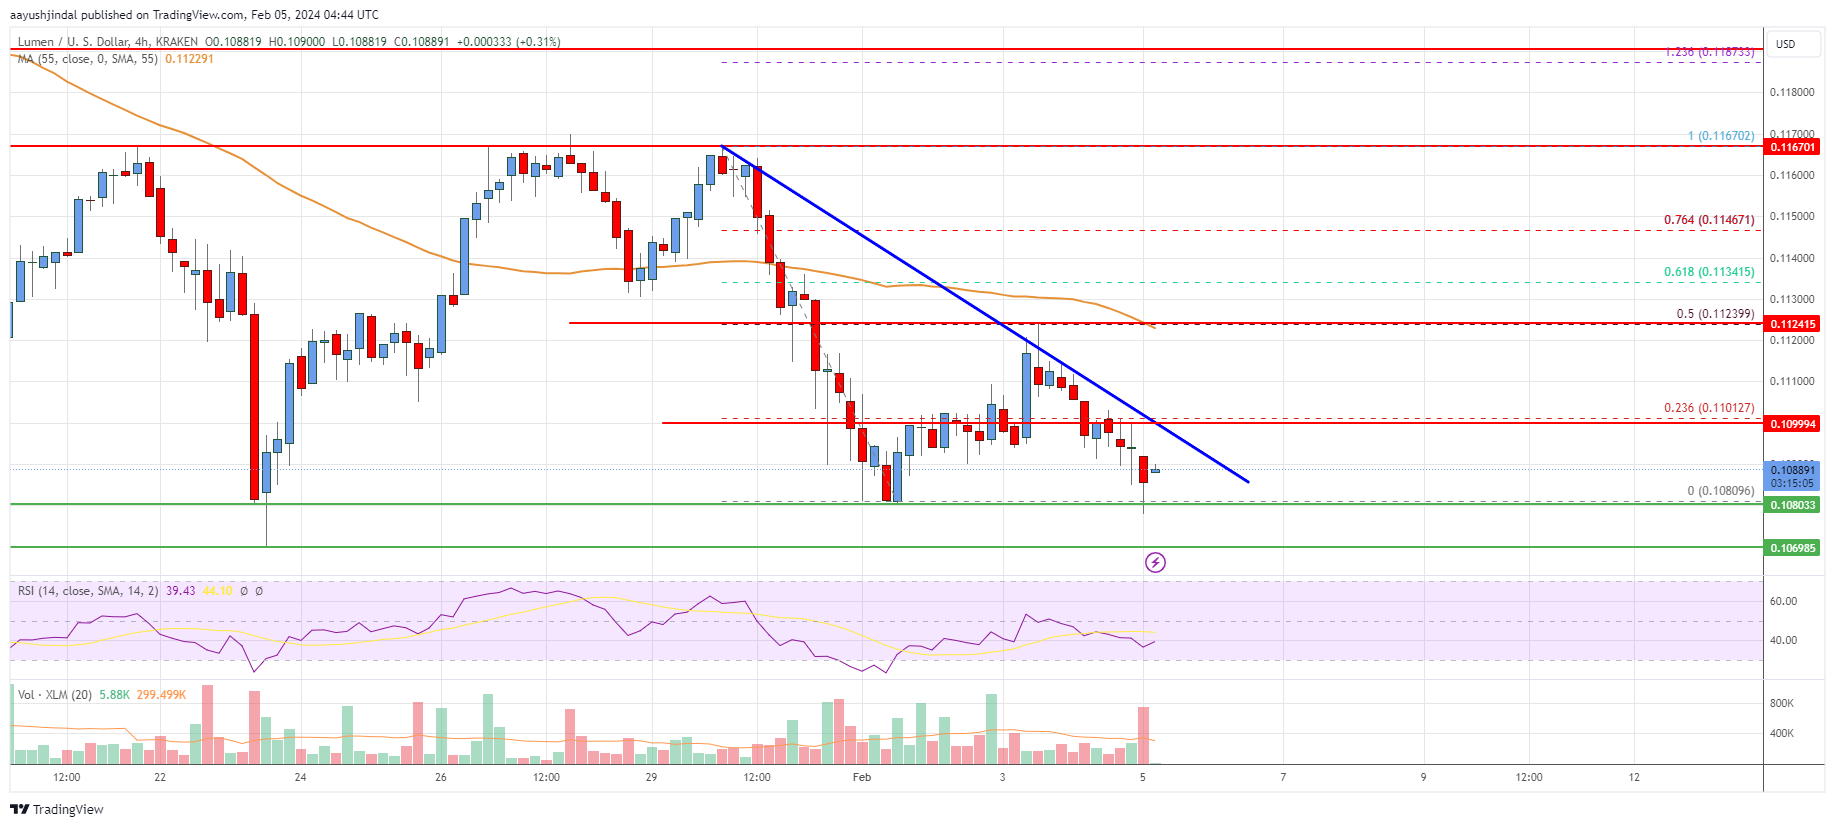
The chart indicates that XLM price is now trading below $0.1120 and the 55 simple moving average (4 hours). Overall, the price could start a fresh increase if it clears the $0.1125 resistance.
Technical Indicators
4 hours MACD – The MACD for XLM/USD is gaining momentum in the bearish zone.
4 hours RSI – The RSI for XLM/USD is now below the 50 level.
Key Support Levels – $0.1080 and $0.1050.
Key Resistance Levels – $0.1100, $0.1125, and $0.1165.