XRP price started a fresh decline from the %excerpt%.5550 resistance against the US dollar. The price is now trading below %excerpt%.540 and the 55 simple moving average (4 hours). There is a key bearish trend forming with resistance near %excerpt%.5300 on the 4-hour chart of the XRP/USD pair (data source from Bittrex). The pair could extend losses if it breaks the %excerpt%.510 support zone. XRP price is struggling below %excerpt%.555 against the US Dollar, unlike Bitcoin. The price could decline further if it settles below the %excerpt%.510 support in the near term. XRP Price Analysis In the past few sessions, Ripple’s XRP price started a fresh decline from the %excerpt%.5550 zone against the US Dollar. The XRP/USD pair stayed below the %excerpt%.535 level and extended its decline. The bears were able to push the
Topics:
Aayush Jindal considers the following as important: Altcoin News, News, Trading, XRP
This could be interesting, too:
Bitcoin Schweiz News writes Meme Coins frühzeitig entdecken: So gelingt der Einstieg vor dem Hype
Bitcoin Schweiz News writes Bitpanda vs. Binance: Welche Bitcoin-App ist die beste für die Schweiz?
Bitcoin Schweiz News writes BlackRock bringt Bitcoin-ETP nach Europa – Was bedeutet das für den Kryptomarkt?
Chayanika Deka writes XRP, SOL, and ADA Inclusion in US Crypto Reserve Pushes Traders on Edge
- XRP price started a fresh decline from the $0.5550 resistance against the US dollar.
- The price is now trading below $0.540 and the 55 simple moving average (4 hours).
- There is a key bearish trend forming with resistance near $0.5300 on the 4-hour chart of the XRP/USD pair (data source from Bittrex).
- The pair could extend losses if it breaks the $0.510 support zone.
XRP price is struggling below $0.555 against the US Dollar, unlike Bitcoin. The price could decline further if it settles below the $0.510 support in the near term.
XRP Price Analysis
In the past few sessions, Ripple’s XRP price started a fresh decline from the $0.5550 zone against the US Dollar. The XRP/USD pair stayed below the $0.535 level and extended its decline.
The bears were able to push the price below the $0.5120 support. A low was formed near $0.4961, and the price is now consolidating losses. There was a minor increase above the $0.5120 level. The price climbed above the 50% Fib retracement level of the downward move from the $0.5548 swing high to the $0.4961 low.
XRP is now trading below $0.535 and the 55 simple moving average (4 hours). Immediate resistance on the upside is near the $0.5300 level. There is also a key bearish trend forming with resistance near the $0.5300 on the 4-hour chart of the XRP/USD pair.
It is near the 61.8% Fib retracement level of the downward move from the $0.5548 swing high to the $0.4961 low. The next major resistance is near the $0.5410 level.
A clear move above $0.5410 might start a fresh increase. In the stated case, the price could even surpass the $0.5550 resistance. Any more gains might send the price toward the $0.600 resistance.
Initial support on the downside is near $0.510. The next major support is near the $0.4960 level. The main support sits at $0.4850. Any more losses could lead the price toward the $0.450 level, below which the price might even test $0.425.
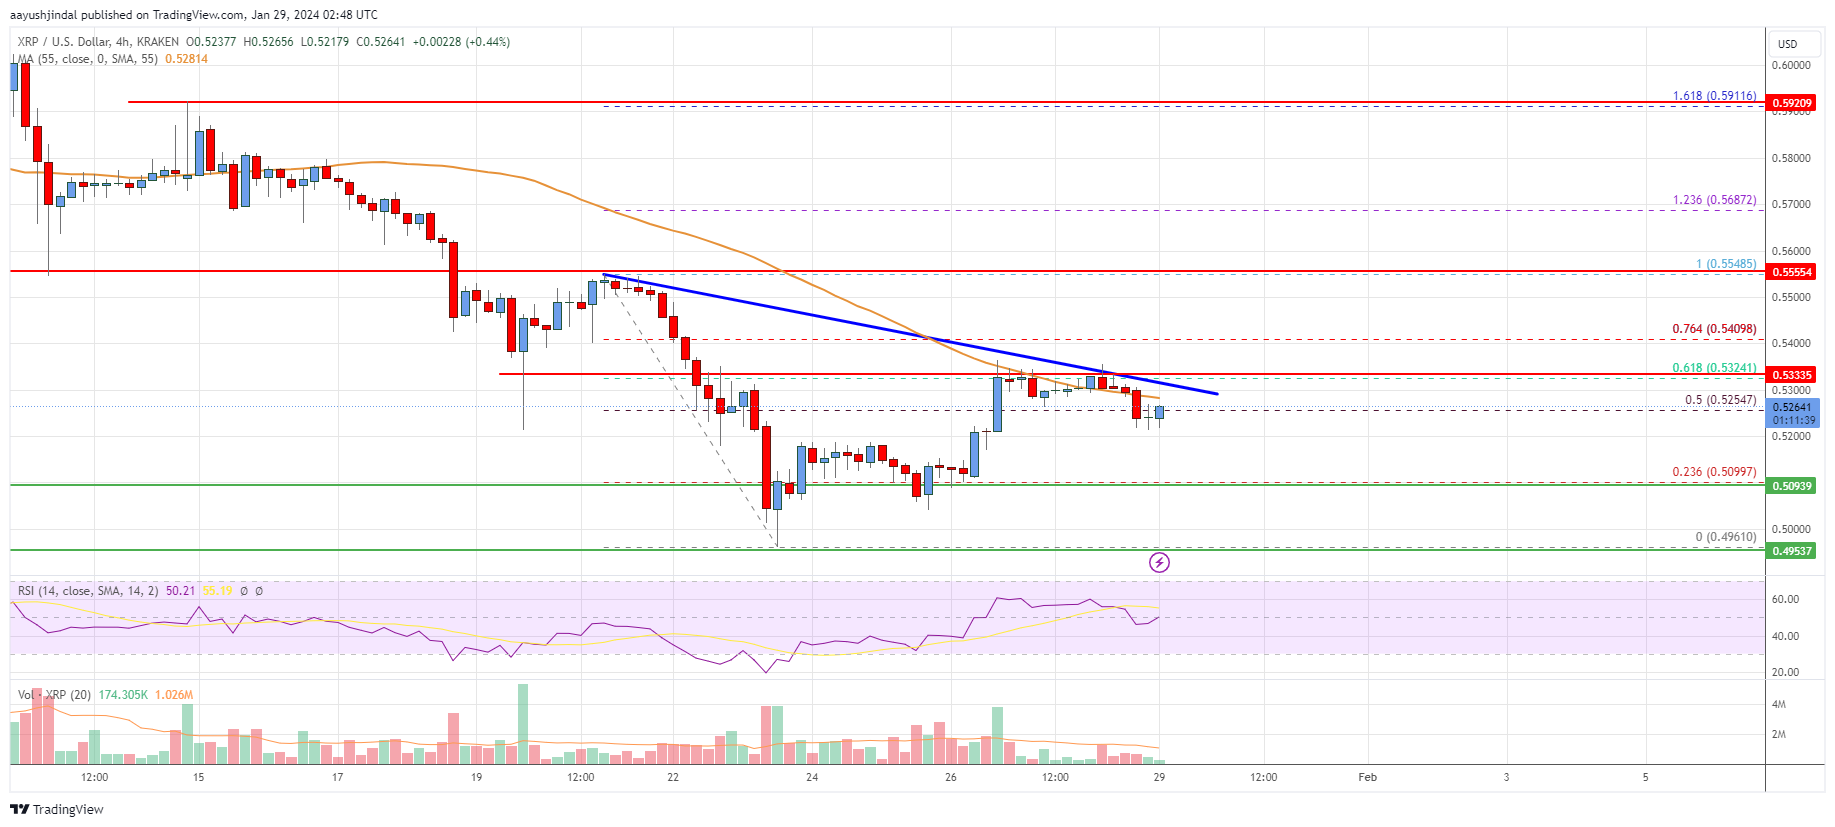
Looking at the chart, XRP price is now trading below the $0.545 zone and the 55 simple moving average (4 hours). Overall, the price could extend losses if it breaks the $0.510 support zone.
Technical indicators
4 hours MACD – The MACD for XRP/USD is now gaining momentum in the bearish zone.
4 hours RSI (Relative Strength Index) – The RSI for XRP/USD is below the 50 level.
Key Support Levels – $0.510, $0.500, and $0.496.
Key Resistance Levels – $0.530 and $0.555.