BitcoinThose who follow cryptocurrency market analysis can see the triangle and the convergence on the chars. The small trading volume also shows the fear index in the market. Resistance in this range is at ,500, which is around the 50MA. Strong support is found at ,000. Technically, it appears that we are on the verge of a move if we break above the support and could challenge ,000. If the price breaks below the support, we might test the other strong support at ,000.EthereumAgainst the USD, the support at 0 held well this week. We saw an attempt to break through the resistance of 0. Support in this range of trading is at around 8.Against Bitcoin, we saw a week of ups and downs after touching the bottom at around 0.016BTC. It can be estimated that this is the bottom in
Topics:
Yoni Berger considers the following as important: Market Updates
This could be interesting, too:
Jordan Lyanchev writes Stellar (XLM) Explodes by 30% in 2 Days, Bitcoin (BTC) Stable at K (Weekend Watch)
Jordan Lyanchev writes Bitcoin Recovers K Following Dump Below K, Ripple Gains 8% (Weekend Watch)
Jordan Lyanchev writes Crypto Markets Shed Over 0B as BTC Slumped to K (Weekend Watch)
Jordan Lyanchev writes BTC Rejected at 0K After .5B Bybit Hack, SEC to Halt Coinbase Lawsuit: Your Weekly Crypto Recap
Bitcoin
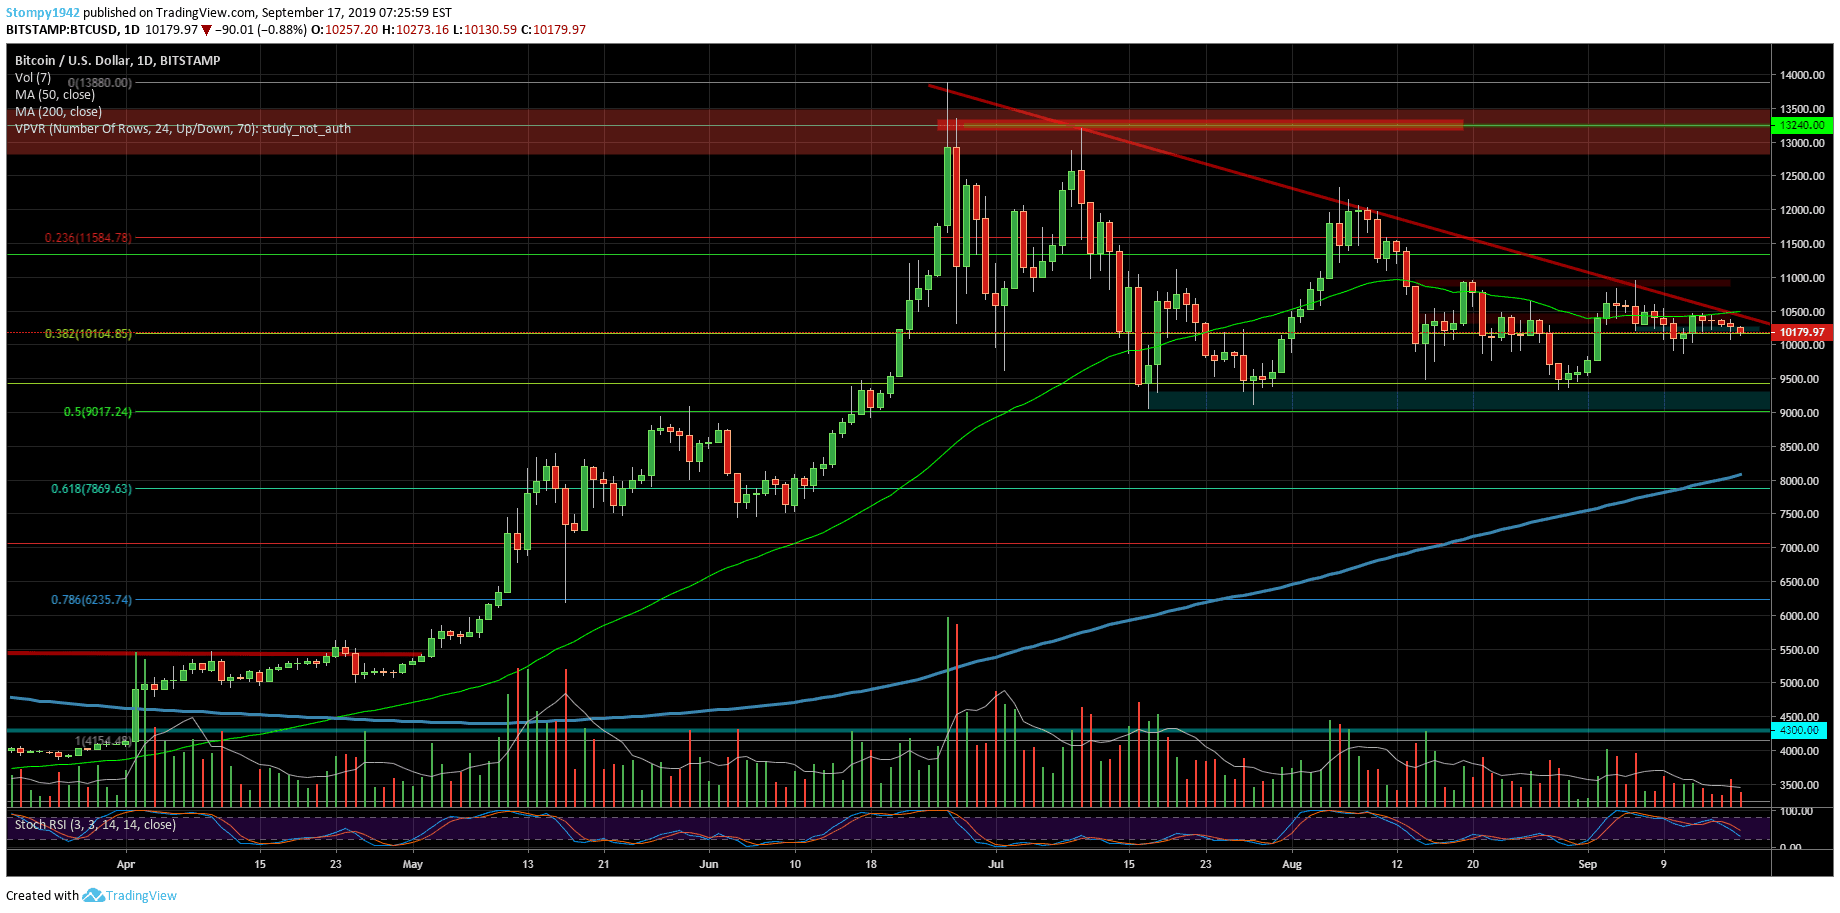
Those who follow cryptocurrency market analysis can see the triangle and the convergence on the chars. The small trading volume also shows the fear index in the market. Resistance in this range is at $10,500, which is around the 50MA. Strong support is found at $10,000. Technically, it appears that we are on the verge of a move if we break above the support and could challenge $12,000. If the price breaks below the support, we might test the other strong support at $9,000.
Ethereum
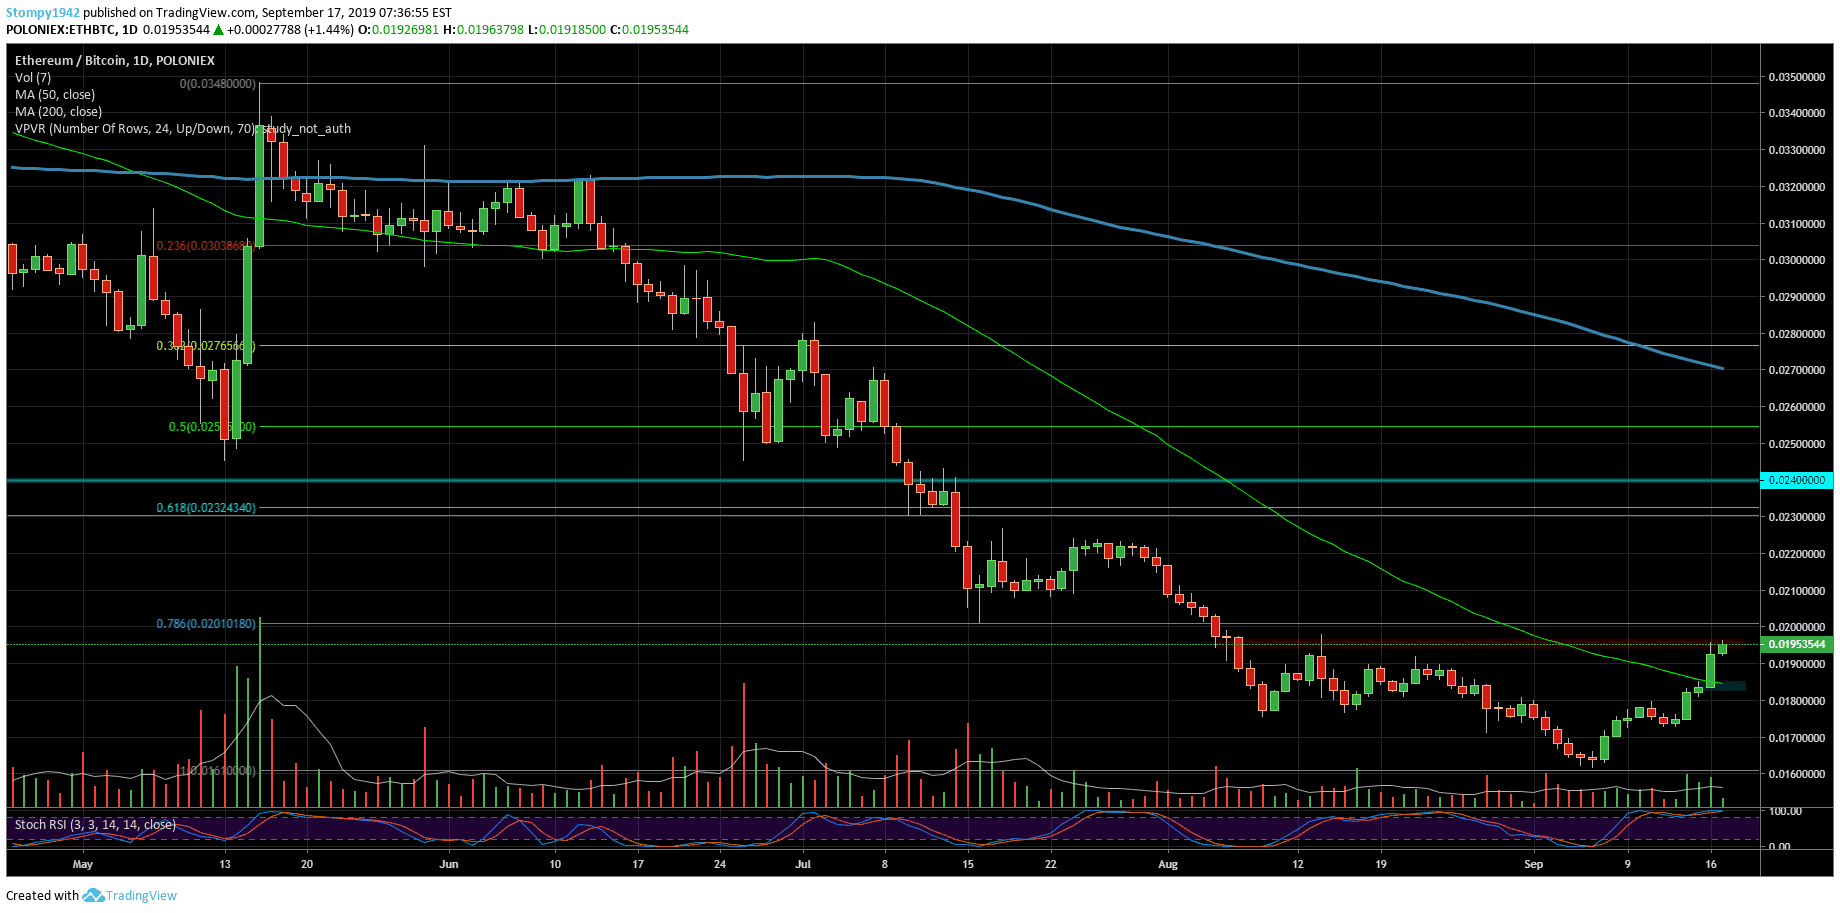
Against the USD, the support at $180 held well this week. We saw an attempt to break through the resistance of $200. Support in this range of trading is at around $188.
Against Bitcoin, we saw a week of ups and downs after touching the bottom at around 0.016BTC. It can be estimated that this is the bottom in this range. Resistance is estimated at 0.02BTC as the support is built around 50MA at 0.018BTC.
Ripple
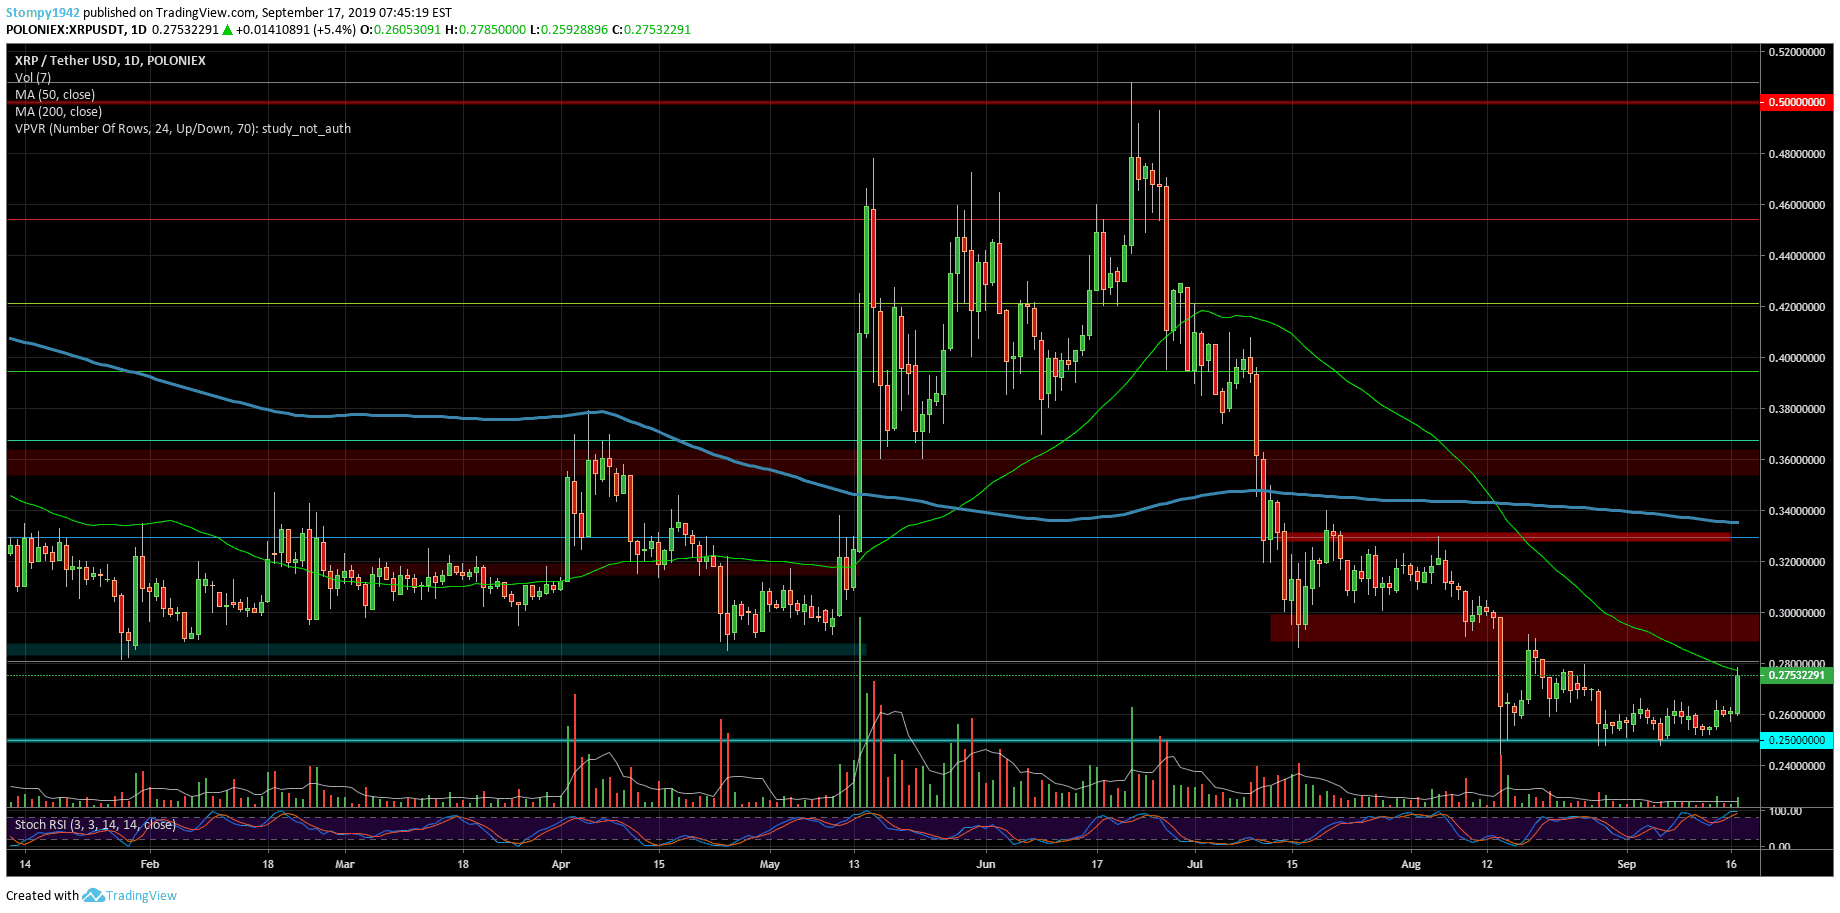
Against the USD, the support around 25 cents holds and it didn’t need more volume to preserve it. A correction brought the price up to the 50MA levels at 28 cents, where we can also see the resistance. If it breaks above that, the other resistance level is at 30 cents. Support hasn’t been tested properly since the last run and it can be estimated at 26 cents.
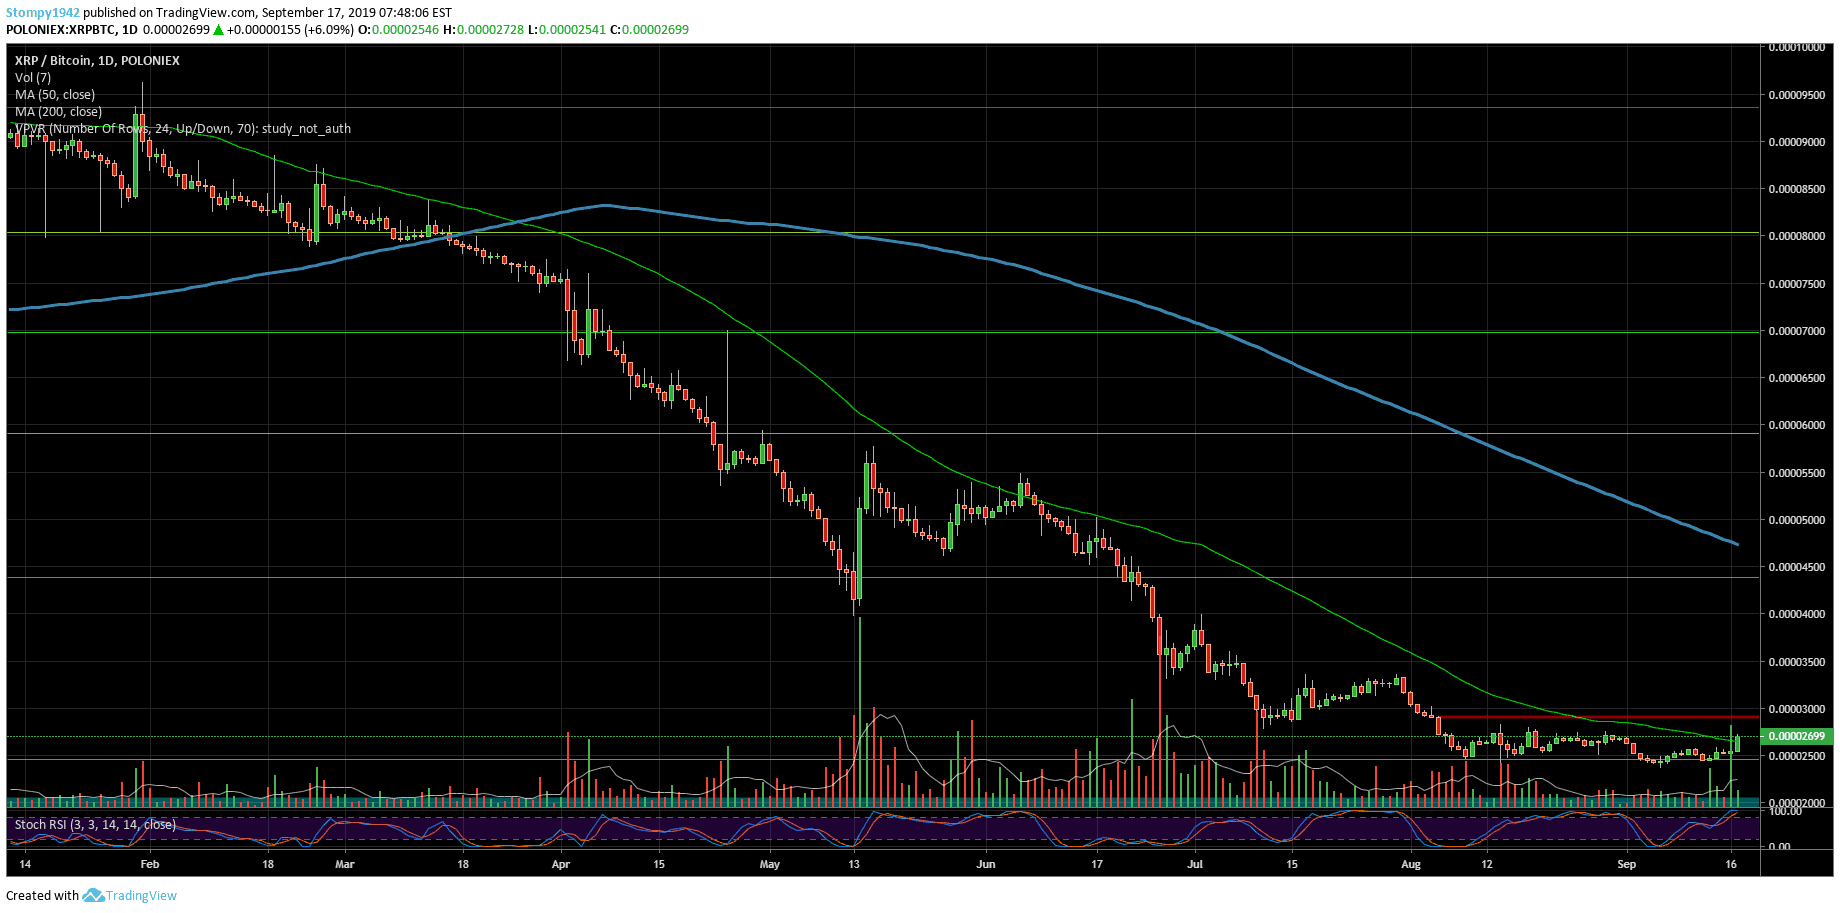
Against BTC, we saw a relatively stable week with support at 2500SAT and resistance at 2800SAT. The trading volume in the past few days has been increasing accordingly.
Kyber
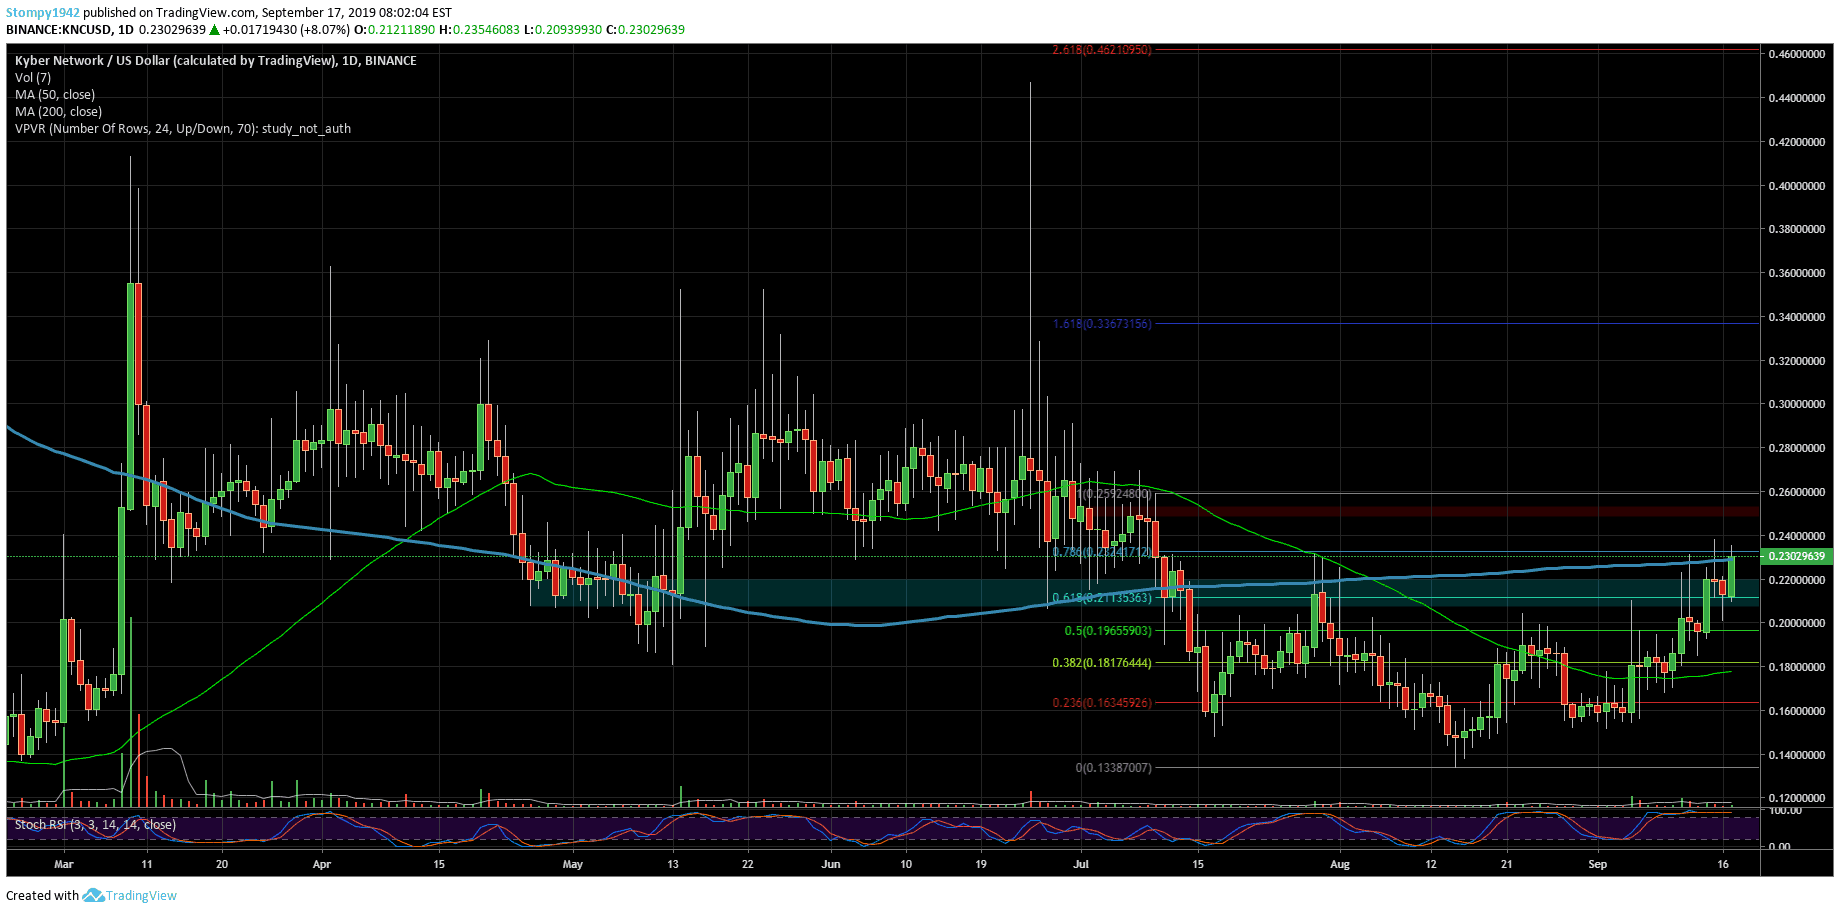
Against the USD, the price is increasing after breaking the resistance at 20 cents. We saw an attempt to break through 25 cents. The support in this range is at 21 cents and it currently holds.
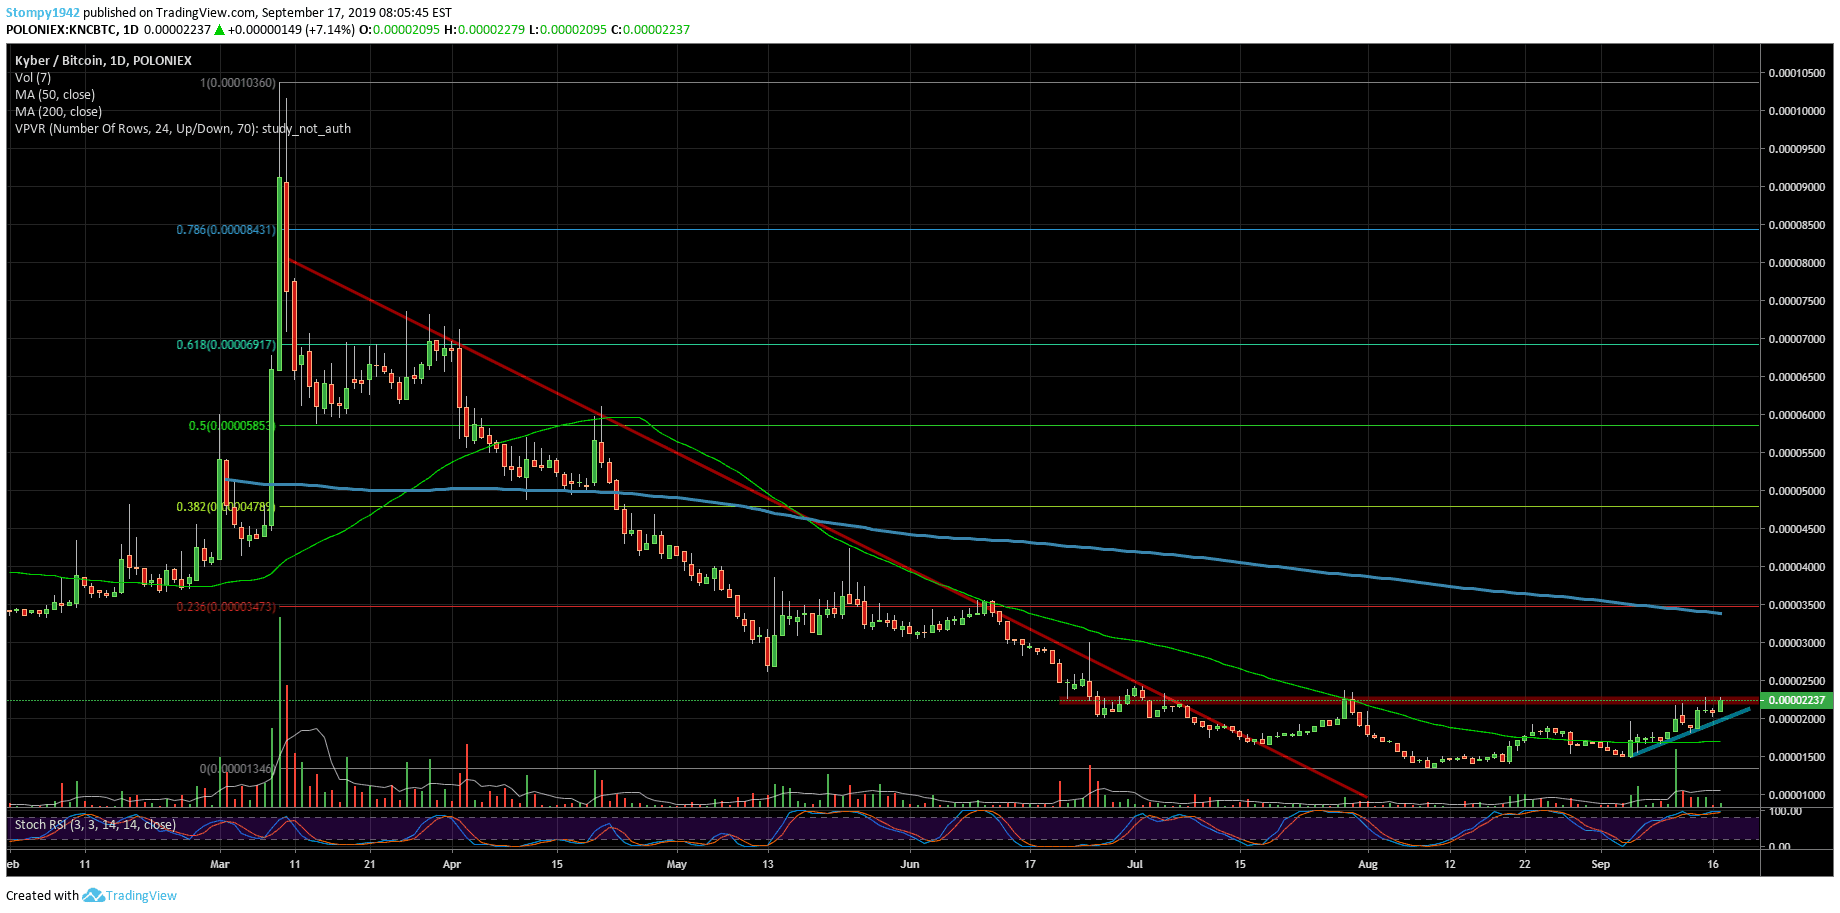
Against BTC, the trend has reversed and is now positive. If the resistance at 2300SAT breaks, we will see a confirmation for the change of trend. Support in this range is at 2000SAT.
Against ETH, after the price stabilized and hit bottom, we saw an attempt to break the 200MA around 0.0012ETH. You can see that there was a sharp run-up and a correction after that. It happened every time those levels were breached. Support is around 50MA or 0.0009ETH.
Vchain
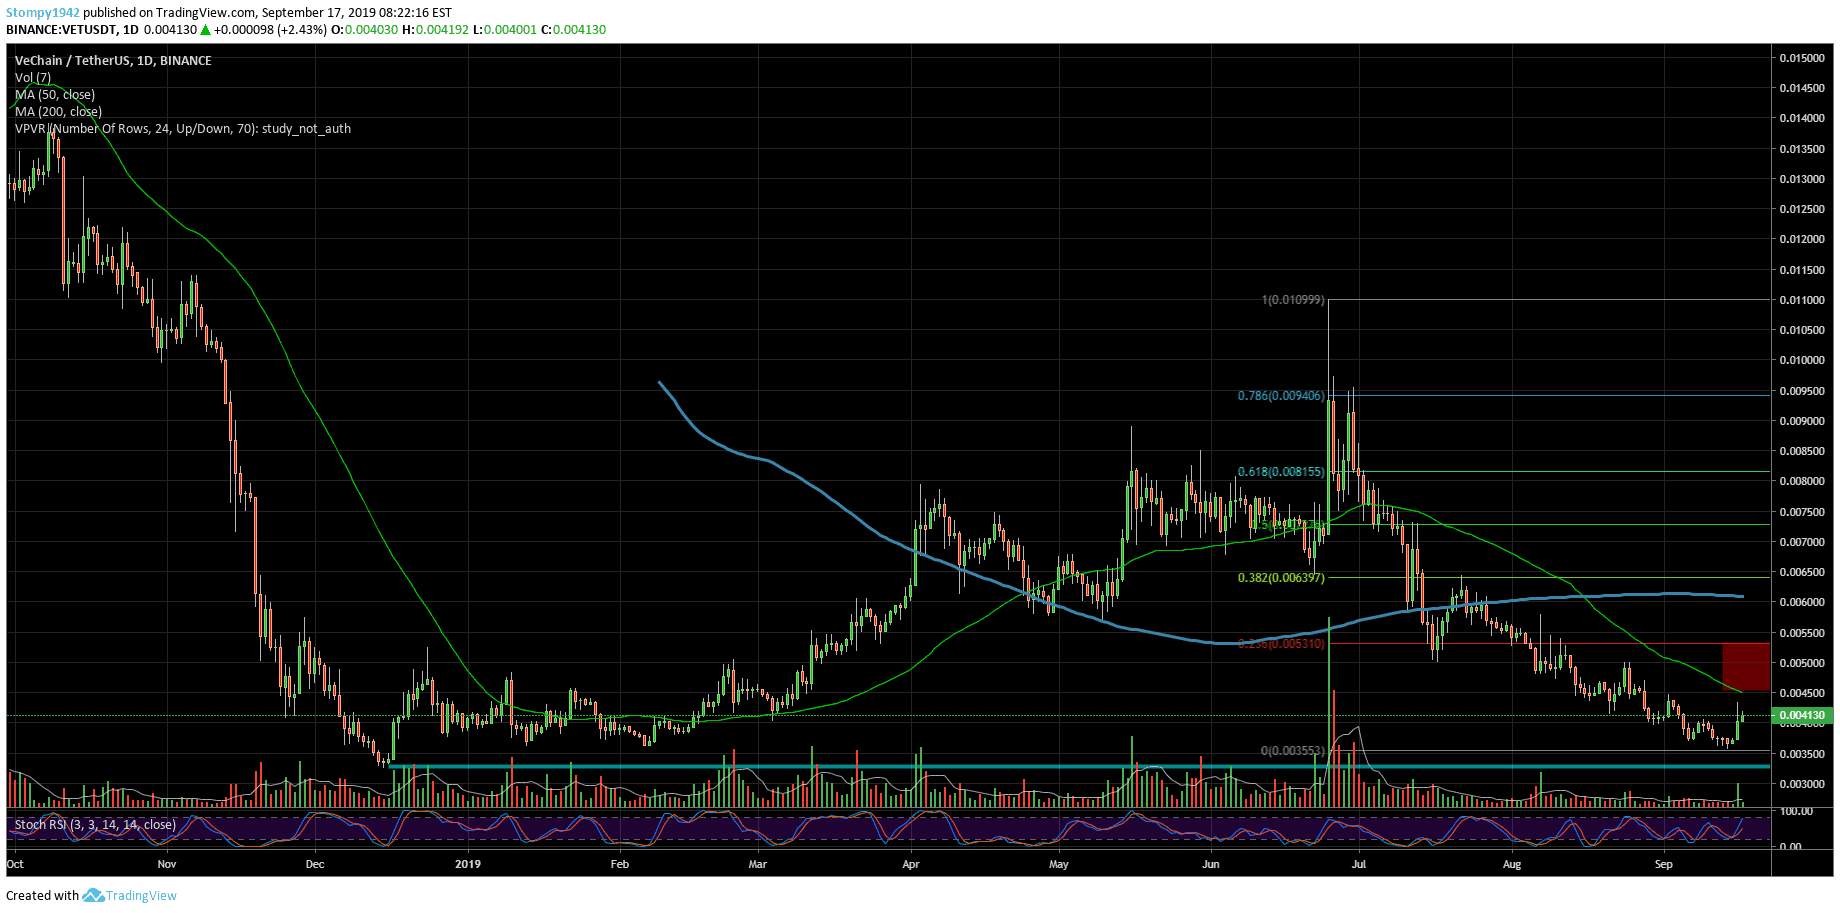
Against the USD, the price is trending downwards but hasn’t returned to the lows of 2018. Support at this range is at $0.0035 which is also the bottom. Resistance is at $0.0045 around the 50MA. If it breaks, the next resistance is at $0.0055.
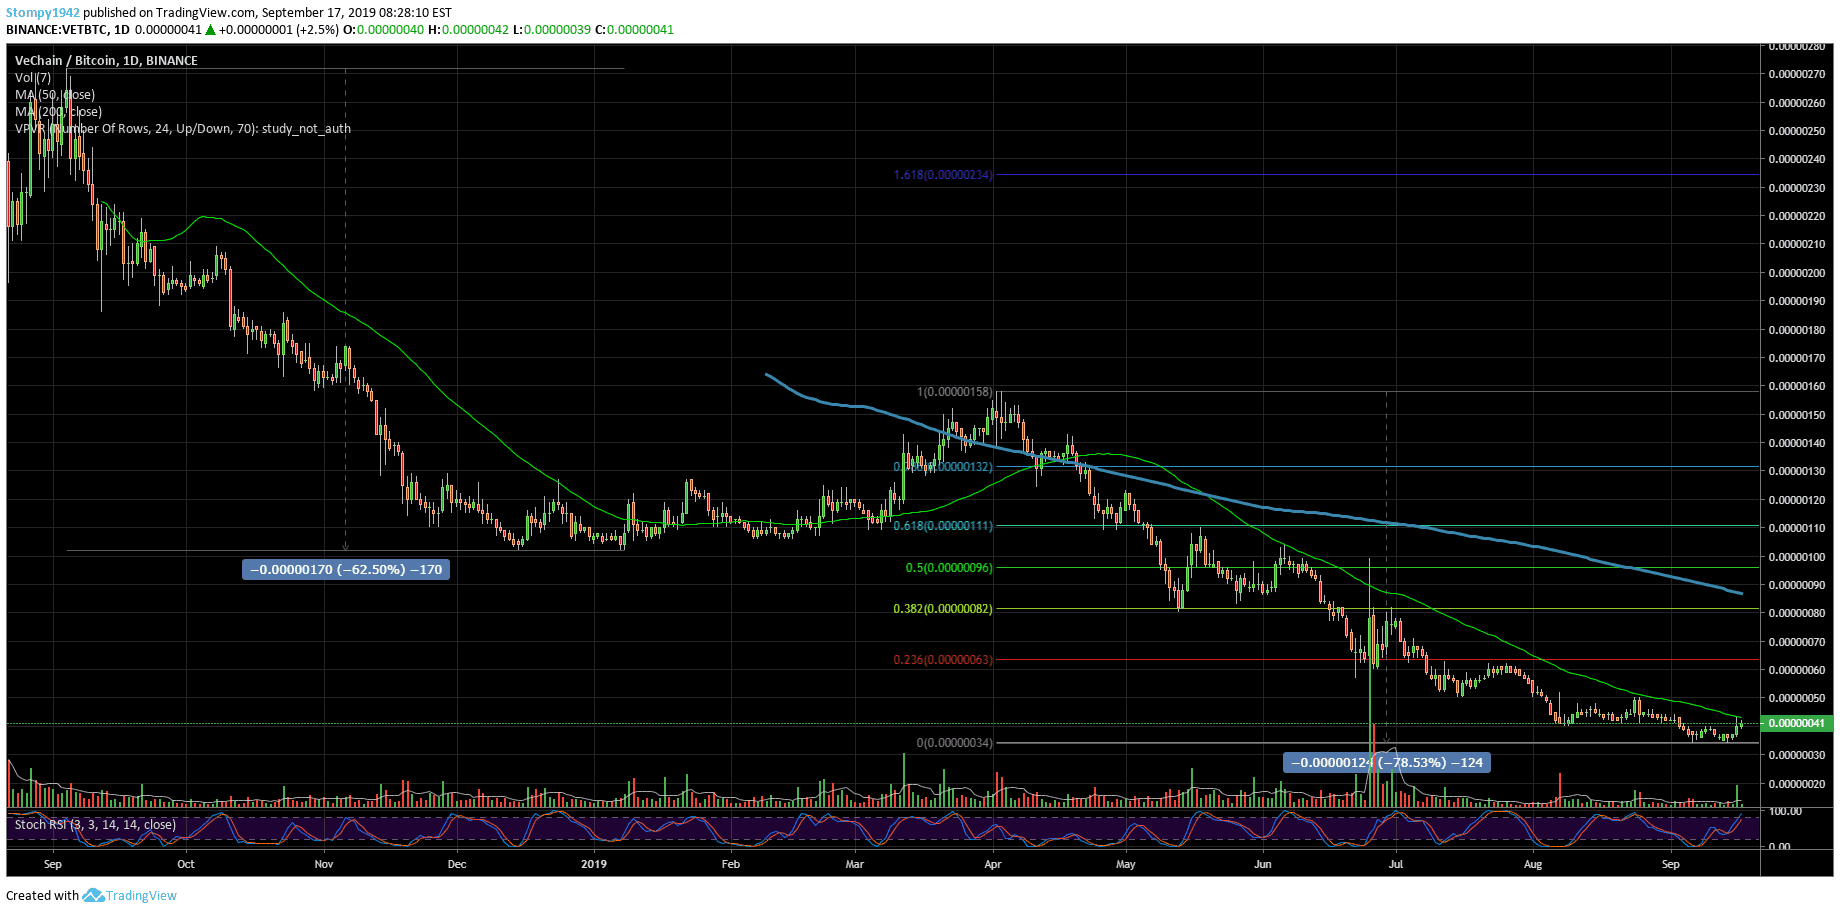
Against Bitcoin, the downward trend has been somewhat curbed compared to the correction we saw earlier – this time it was 78% this time compared to 62% in the previous one. Is this enough, though? Resistance in this range is being tested at the 50MA around 41SAT. The support is at 34SAT, which is also the bottom.

