XRP/USD – XRP Spikes As Low As %excerpt%.928 Key Support Levels: .05, .00, %excerpt%.92 – %excerpt%.9.Key Resistance Levels: .20, .25, .36. XRP was trading inside an ascending price channel since breaking the symmetrical triangle pattern at the end of July. The price channel allowed XRP to break the August high at .36 this week and reach .40. Unfortunately, the steep market sell-off yesterday caused XRP to fall beneath the ascending price channel. XRP collapsed by a total of 33% yesterday, causing the coin to spike beneath and reach as low as %excerpt%.928 (.618 Fib). It has since rebounded from there to climb back above and reach .10. XRP/USD Daily Chart. Source: TradingView.XRP-USD Short Term Price Prediction Looking ahead, the first resistance lies at .20 (20-day MA). This
Topics:
Yaz Sheikh considers the following as important: Ripple (XRP) Price, XRP Analysis, xrpbtc, xrpusd
This could be interesting, too:
Jordan Lyanchev writes Ripple’s (XRP) Surge to Triggers Over Million in Short Liquidations
Jordan Lyanchev writes Trump Confirms Work on Strategic Crypto Reserve: XRP, ADA, SOL Included
Dimitar Dzhondzhorov writes Is a Major Ripple v. SEC Lawsuit Development Expected This Week? Here’s Why
Mandy Williams writes Ripple Releases Institutional DeFi Roadmap for XRP Ledger in 2025
XRP/USD – XRP Spikes As Low As $0.928
Key Support Levels: $1.05, $1.00, $0.92 – $0.9.
Key Resistance Levels: $1.20, $1.25, $1.36.
XRP was trading inside an ascending price channel since breaking the symmetrical triangle pattern at the end of July. The price channel allowed XRP to break the August high at $1.36 this week and reach $1.40.
Unfortunately, the steep market sell-off yesterday caused XRP to fall beneath the ascending price channel. XRP collapsed by a total of 33% yesterday, causing the coin to spike beneath $1 and reach as low as $0.928 (.618 Fib). It has since rebounded from there to climb back above $1 and reach $1.10.
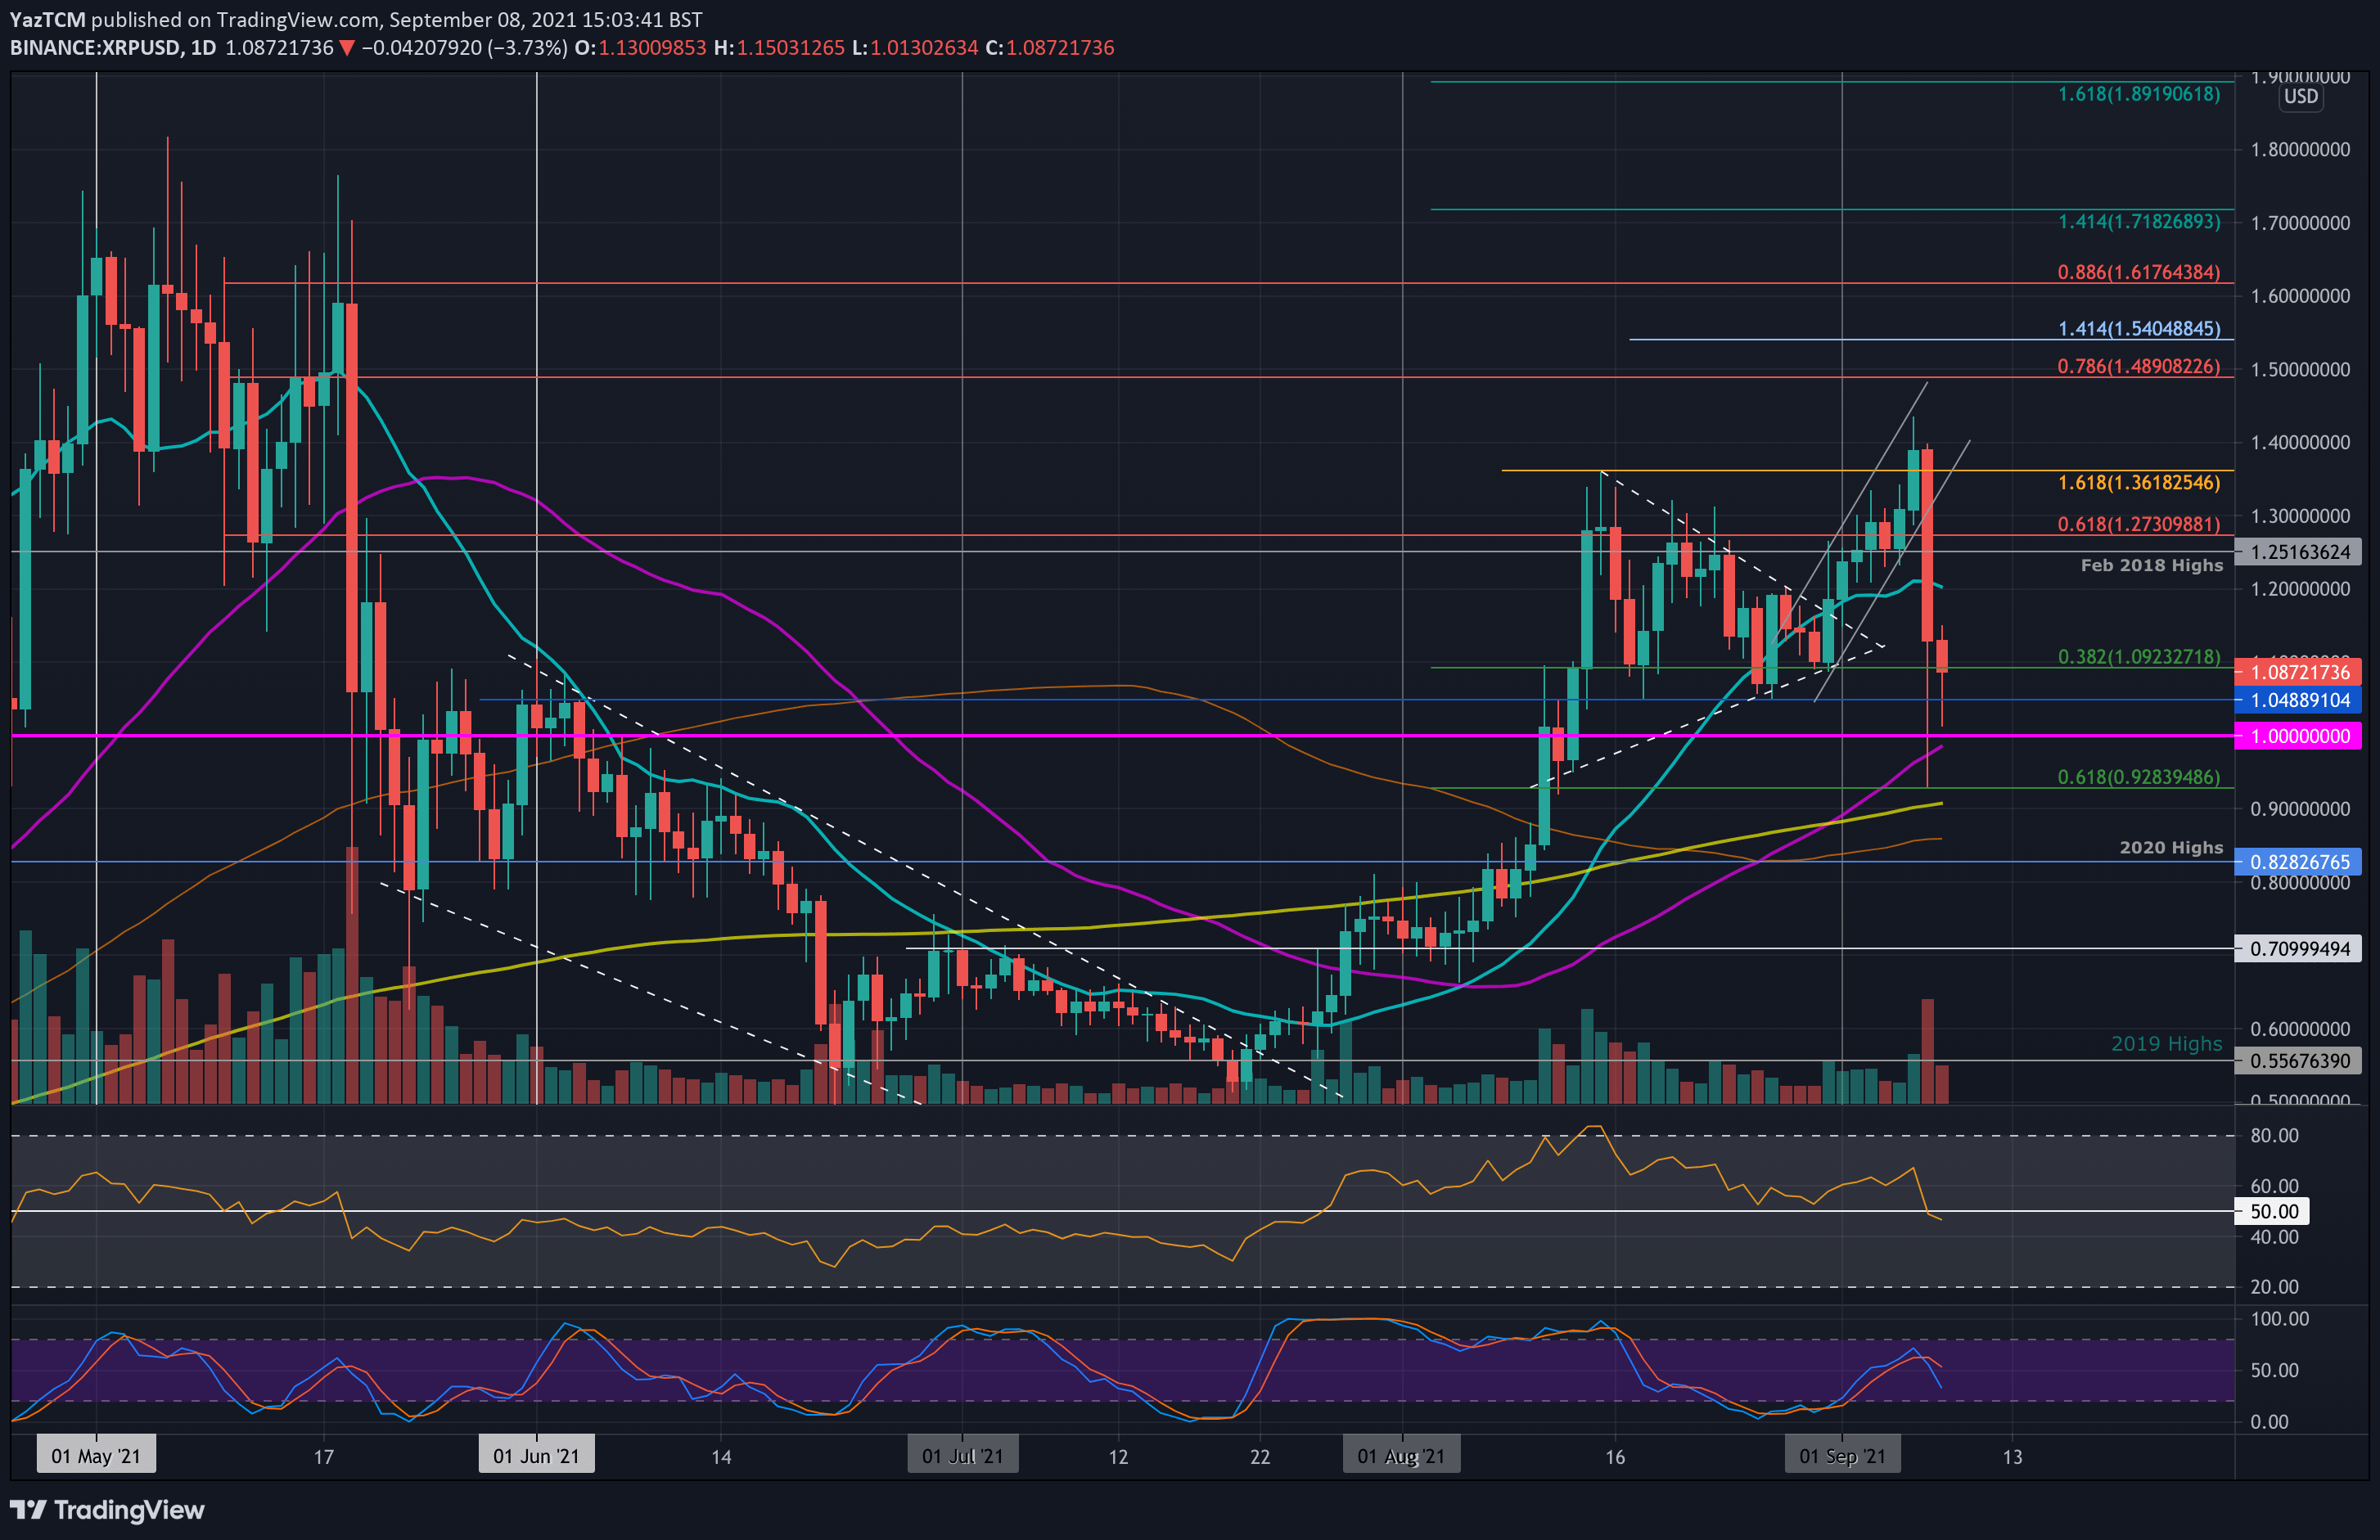
XRP-USD Short Term Price Prediction
Looking ahead, the first resistance lies at $1.20 (20-day MA). This is followed by $1.25 (Feb 2018 highs), $1.36 (August highs), and $1.40.
On the other side, the first support lies at $1.05. This is followed by $1.00 (50-day MA), $0.92 – $0.9 (.618 Fib & 200-day MA), and $0.8282 (2020 high).
The RSI recently fell beneath the midline, indicating that the sellers are taking over the market momentum.
XRP/BTC – XRP Falls Beneath 20-day MA.
Key Support Levels: 2290 SAT, 2200 SAT, 2155 SAT.
Key Resistance Levels: 2455 SAT, 2670 SAT, 2800 sAT>
Against BTC, XRP spiked as high as 2700 SAT on Monday but went on to collapse yesterday during the market sell-off. XRP dropped beneath the 20-day MA and fell as low as 2200 SAT (50 day-MA).
The bulls regrouped by the end of the day to close the candle at 2400 SAT. It has since dropped slightly and trades at 2350 SAT.
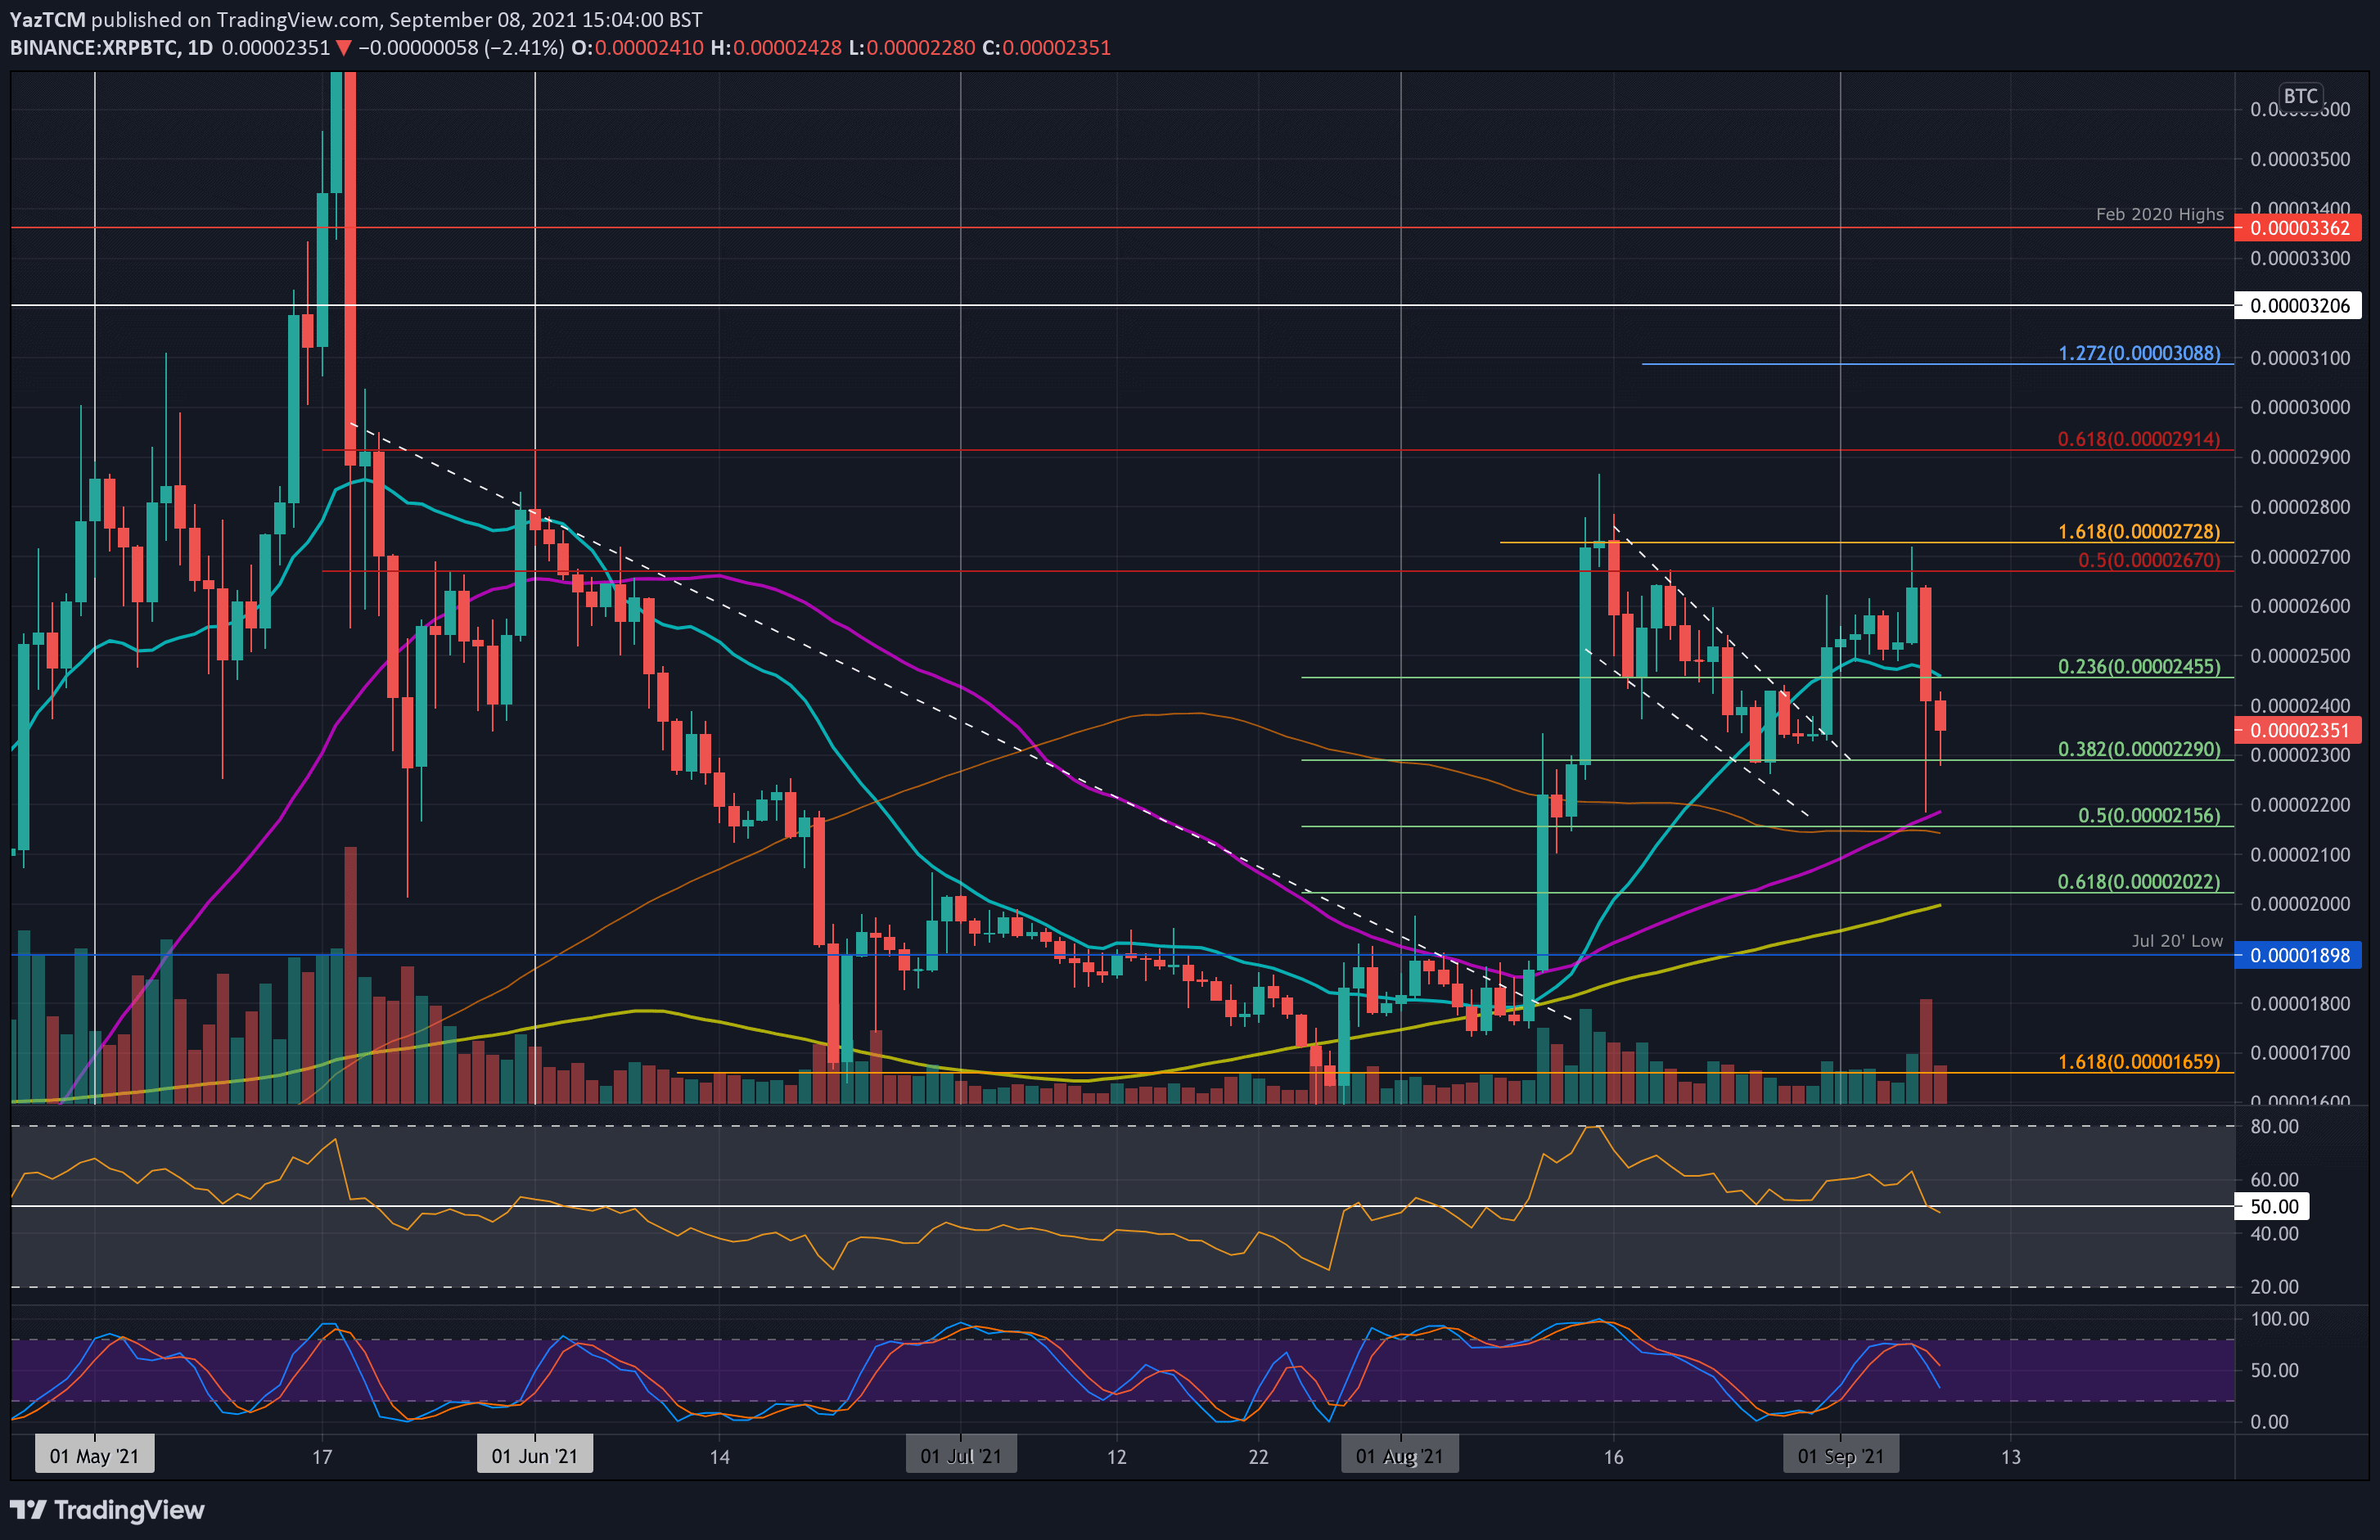
XRP-BTC Short Term Price Prediction
Looking ahead, the first support lies at 2290 SAT (.382 Fib). This is followed by 2200 SAT (50-day MA), 2155 SAT (.5 Fib & 100-day MA), and 2000 SAT (.618 Fib & 200-day MA).
On the other side, the first resistance lies at 2455 SAT (20-day MA). This is followed by 2670 SAT (bearish .5 Fib), 2800 SAT, 2915 SAT (Bearish .618 Fib), and 3000 SAT.
Again, the RSI is starting to poke beneath the midline, indicating that the sellers are starting to take control of the market momentum again.