LINK/USD – LINK Sets Fresh ATH Above .77Key Support Levels: .77, , .17.Key Resistance Levels: .57, .82, , .70.At the start of January, LINK started to surge higher but became stuck by resistance at .17 (bearish .886 Fib Retracement). From there, it started to head lower until support was found at a couple of days ago.LINK bounced from the support at .06 on Wednesday and started to push higher. It closed the daily candle yesterday at around and continued higher beyond the .17 resistance today.After .17, LINK went on to break the previous ATH price at .77 and continued upward to set a new ATH at .82 (1.414 Fib Extension). It has since dropped slightly to trade around .15.LINK/USD Daily Chart. Source: TradingViewLINK-USD Short Term Price
Topics:
Yaz Sheikh considers the following as important: Chainlink (LINK) Price, LINKBTC, LINKUSD, Price Analysis
This could be interesting, too:
Chayanika Deka writes Chainlink’s MVRV Ratio Signals Selling Exhaustion: What’s Next for LINK?
Chayanika Deka writes Whale and Shark Activity Pushes Chainlink (LINK) Past For the First Time in 37 Months
Martin Young writes Chainlink Partners With Major Finance Firms on AI, Oracles, and Blockchain Data Solution Project
Dimitar Dzhondzhorov writes Top 10 Cryptocurrencies by ‘Notable Development Activity’ (Santiment)
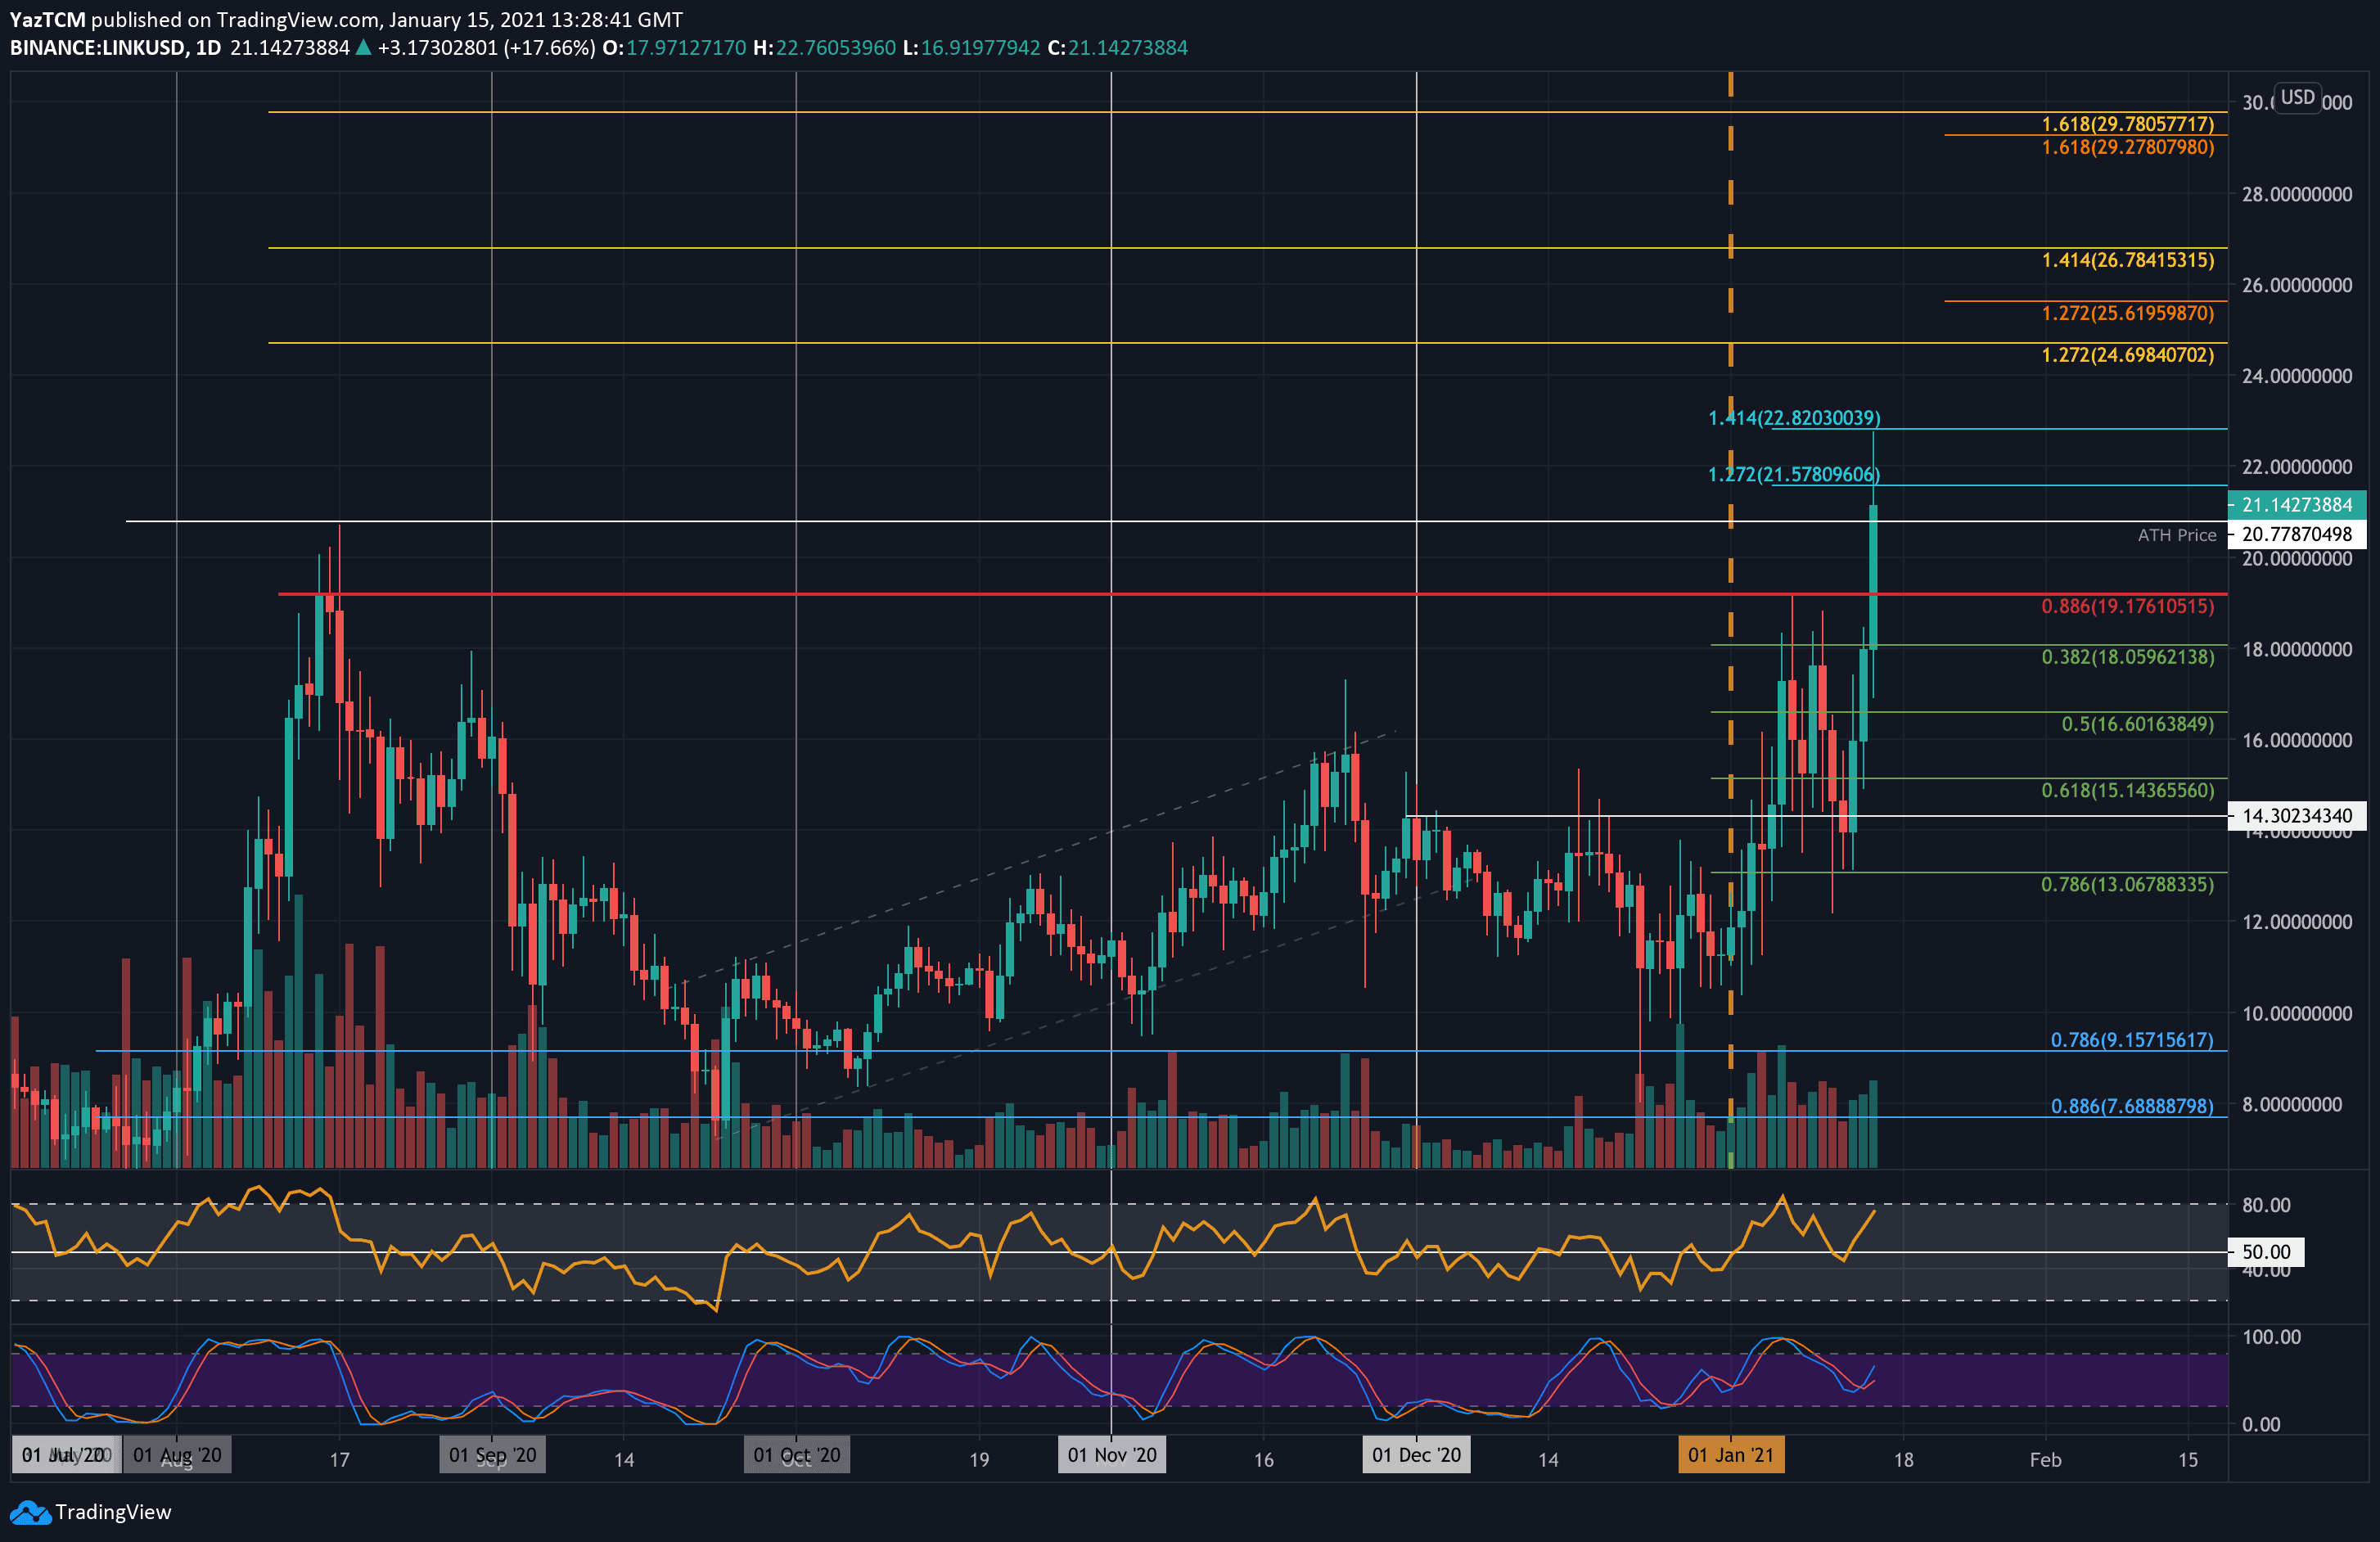
LINK/USD – LINK Sets Fresh ATH Above $20.77
Key Support Levels: $20.77, $20, $19.17.
Key Resistance Levels: $21.57, $22.82, $24, $24.70.
At the start of January, LINK started to surge higher but became stuck by resistance at $19.17 (bearish .886 Fib Retracement). From there, it started to head lower until support was found at $13 a couple of days ago.
LINK bounced from the support at $13.06 on Wednesday and started to push higher. It closed the daily candle yesterday at around $18 and continued higher beyond the $19.17 resistance today.
After $19.17, LINK went on to break the previous ATH price at $20.77 and continued upward to set a new ATH at $22.82 (1.414 Fib Extension). It has since dropped slightly to trade around $21.15.
LINK-USD Short Term Price Prediction
Looking ahead, the first level of resistance lies at $21.57 (1.272 Fib Extension). This is followed by resistance at the new ATH price of $22.82 (1.414 Fib Extension), $24, and $24.70 (long term 1.272 Fib Extension).
Beyond $25, resistance lies at $25.61, $26.78 (long term 1.414 Fib Extension), $28, and $29.78.
On the other side, the first level of support lies at the previous ATH price at $20.77. This is followed by $20, $19.17, $18.05 (.382 Fib), and $16.60 (.5 Fib).
The RSI is back above the mid-line as the bulls take charge of the market momentum and still has room to drive upward before becoming overbought.
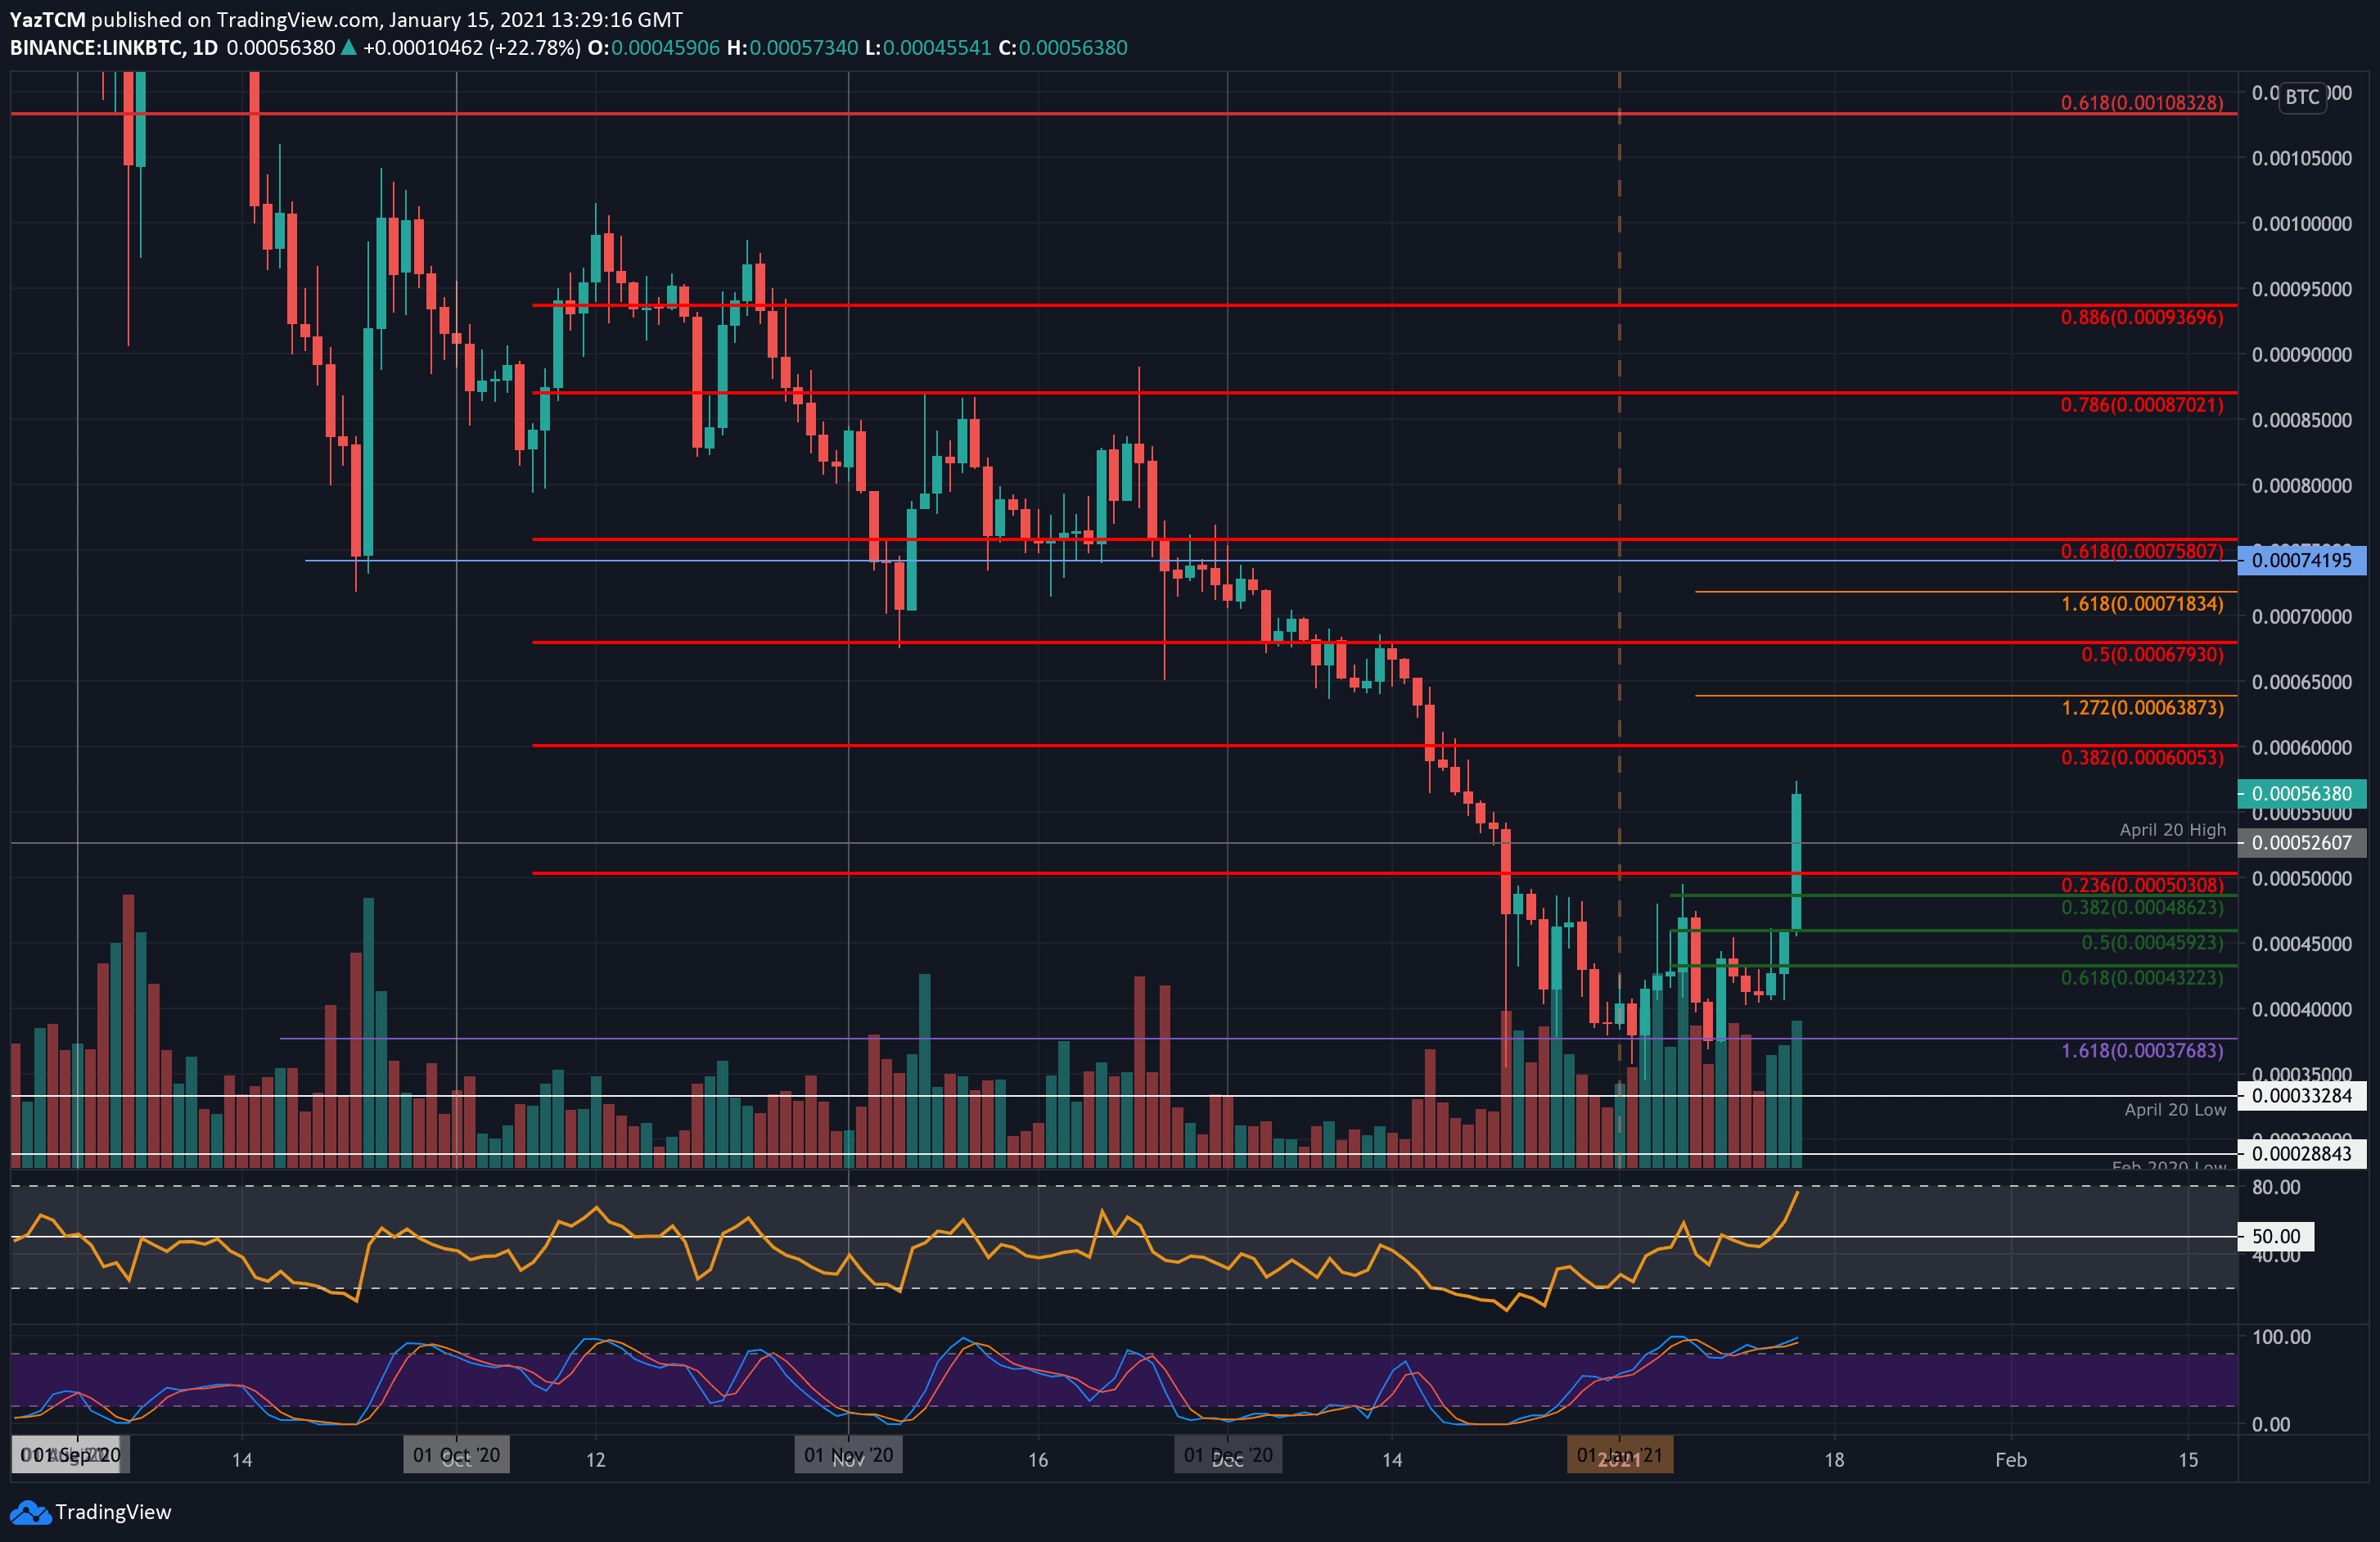
LINK/BTC – Buyers Push Above April 2020 Highs.
Key Support Levels: 55,000 SAT, 52,600 SAT, 50,000 SAT.
Key Resistance Levels: 60,000 SAT, 63,875 SAT, 67,930 SAT.
Against Bitcoin, LINK pushed higher from 40,000 SAT yesterday and continued higher today to break resistance at 50,000 SAT (bearish .236 Fib Retracement).
After breaking 50,000 SAT, LINK proceeded to push above resistance at 52,600 SAT (April 2020 highs) to reach the current 56,400 SAT level.
LINK-BTC Short Term Price Prediction
Moving forward, the first level of resitance lies at 60,000 SAT (bearish .382 Fib Retracement). This is followed by 63,875 (1.272 Fib Extension), 67,930 SAT (bearish .5 Fib Retracement), and 71,835 (1.618 Fib Extension).
On the other side, the first level of support lies at 55,000 SAT. This is followed by 52,600 SAT (April 2020 High), 50,000 SAT, and 48,625 SAT (.382 Fib Retracement).
The RSI has pushed higher as the bulls take charge of the market momentum. It is still not yet overbought, indicating the market has room to push higher.