Ripple’s price has struggled to break the significant descending trendline at %excerpt%.42 and is consolidating. However, it now faces the critical support level of the 200-day moving average. Technical Analysis By Shayan The Daily Chart Ripple’s price action has been dull after failing to surpass the %excerpt%.42 substantial resistance level, which also aligns with the descending trendline. The price plummeted slightly and reached the 200-day moving average at %excerpt%.395. Therefore, the cryptocurrency is stuck in a very tight range between %excerpt%.42 and %excerpt%.395. A breakout from this range will likely lead to an impulsive move, as there is an enormous amount of liquidity above and below it. Source: TradingviewThe 4-Hour Chart In the 4-hour timeframe, the weakened bullish momentum is evident as
Topics:
CryptoVizArt considers the following as important: Ripple (XRP) Price, XRP Analysis, xrpbtc, xrpusd
This could be interesting, too:
Jordan Lyanchev writes Ripple’s (XRP) Surge to Triggers Over Million in Short Liquidations
Jordan Lyanchev writes Trump Confirms Work on Strategic Crypto Reserve: XRP, ADA, SOL Included
Dimitar Dzhondzhorov writes Is a Major Ripple v. SEC Lawsuit Development Expected This Week? Here’s Why
Mandy Williams writes Ripple Releases Institutional DeFi Roadmap for XRP Ledger in 2025
Ripple’s price has struggled to break the significant descending trendline at $0.42 and is consolidating. However, it now faces the critical support level of the 200-day moving average.
Technical Analysis
By Shayan
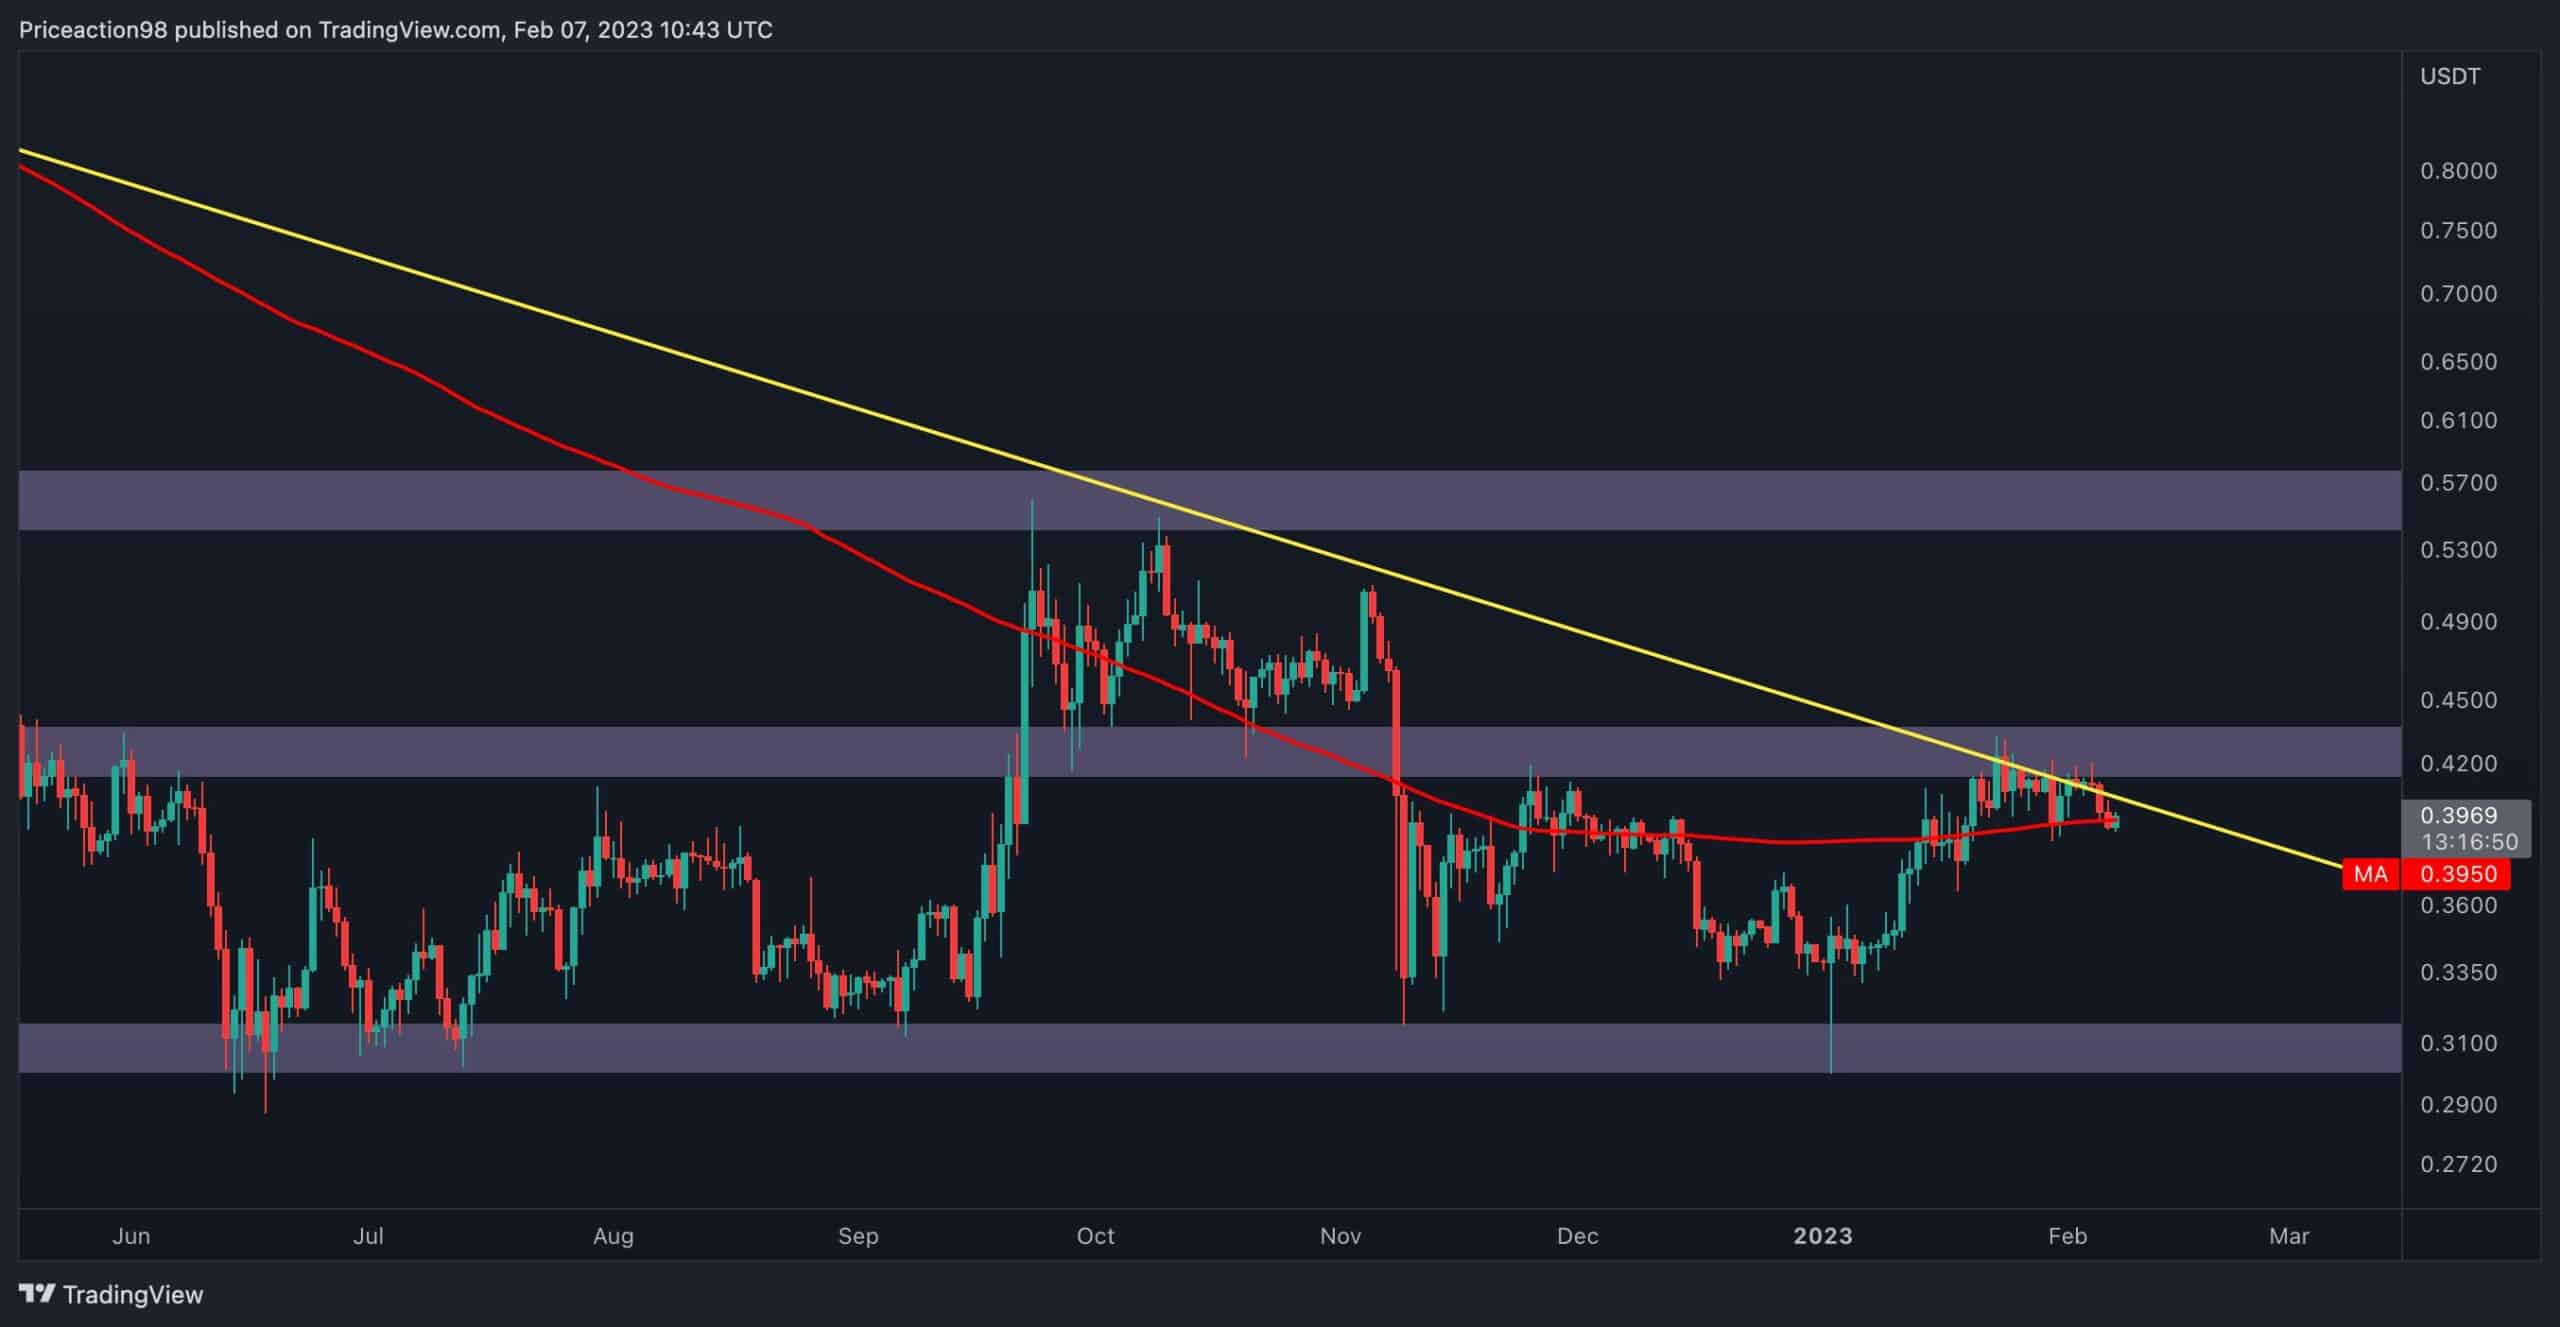
The Daily Chart
Ripple’s price action has been dull after failing to surpass the $0.42 substantial resistance level, which also aligns with the descending trendline.
The price plummeted slightly and reached the 200-day moving average at $0.395. Therefore, the cryptocurrency is stuck in a very tight range between $0.42 and $0.395. A breakout from this range will likely lead to an impulsive move, as there is an enormous amount of liquidity above and below it.
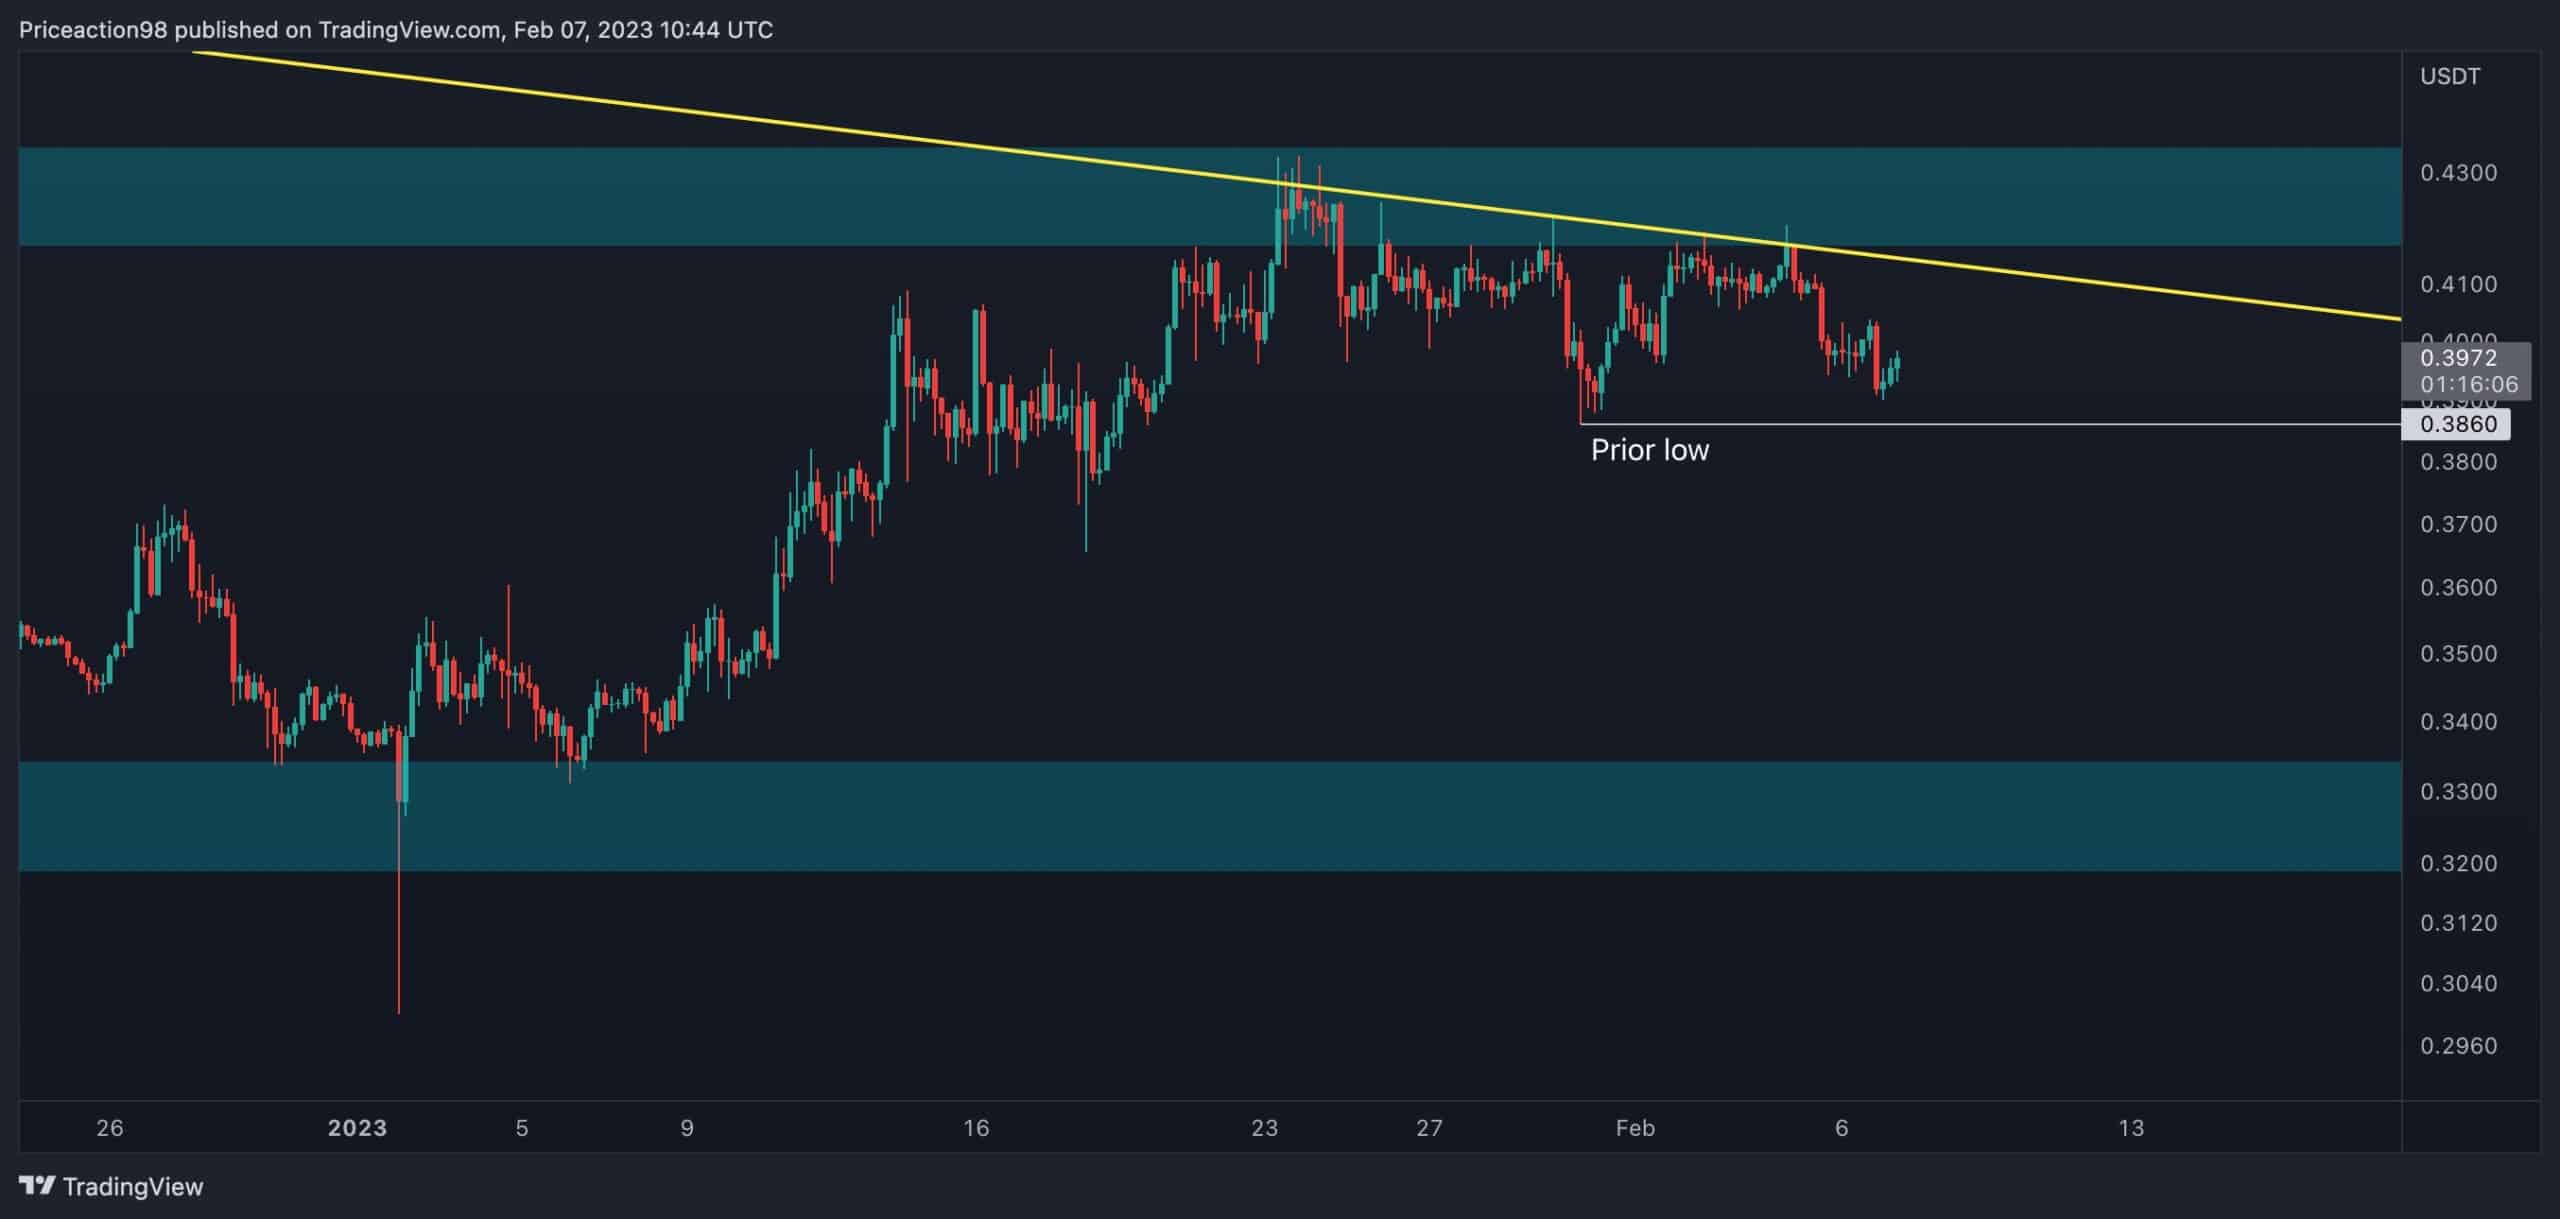
The 4-Hour Chart
In the 4-hour timeframe, the weakened bullish momentum is evident as the price failed to print another higher high after reaching the $0.42 region and was rejected from the trendline after several attempts.
Nevertheless, the cryptocurrency faces a mid-range support level at $0.386, which is the prior central pivot. If XRP finds support at the mentioned level, the price might initiate a rally, attempting to surpass the trendline.
On the contrary, if it drops below its prior low, the uptrend will end, and the market should expect a reversal. In this case, Ripple’s next level of support will be the $0.33 region.