Ripple’s price was rejected from a key resistance level a few weeks ago, highlighting indecisiveness. Even so, there is still hope for the bulls that the rally is not over. Technical Analysis By: Edris XRP/USDT Daily Chart XRP’s price failed to break through the %excerpt%.55 resistance level and has been dropping since. The 50-day moving average is currently providing support near the %excerpt%.46 mark and is closely followed by the 200-day moving average at around %excerpt%.41. This confluence of support elements makes the %excerpt%.40 level significantly important, and a break below would likely lead to a rapid drop toward the %excerpt%.3 mark in the coming weeks. On the other hand, a rebound from this area would pave the way for another test of the %excerpt%.5 resistance zone, with a higher probability for a
Topics:
CryptoVizArt considers the following as important: Ripple (XRP) Price, XRP Analysis, xrpbtc, xrpusd
This could be interesting, too:
Jordan Lyanchev writes Ripple’s (XRP) Surge to Triggers Over Million in Short Liquidations
Jordan Lyanchev writes Trump Confirms Work on Strategic Crypto Reserve: XRP, ADA, SOL Included
Dimitar Dzhondzhorov writes Is a Major Ripple v. SEC Lawsuit Development Expected This Week? Here’s Why
Mandy Williams writes Ripple Releases Institutional DeFi Roadmap for XRP Ledger in 2025
Ripple’s price was rejected from a key resistance level a few weeks ago, highlighting indecisiveness. Even so, there is still hope for the bulls that the rally is not over.
Technical Analysis
By: Edris
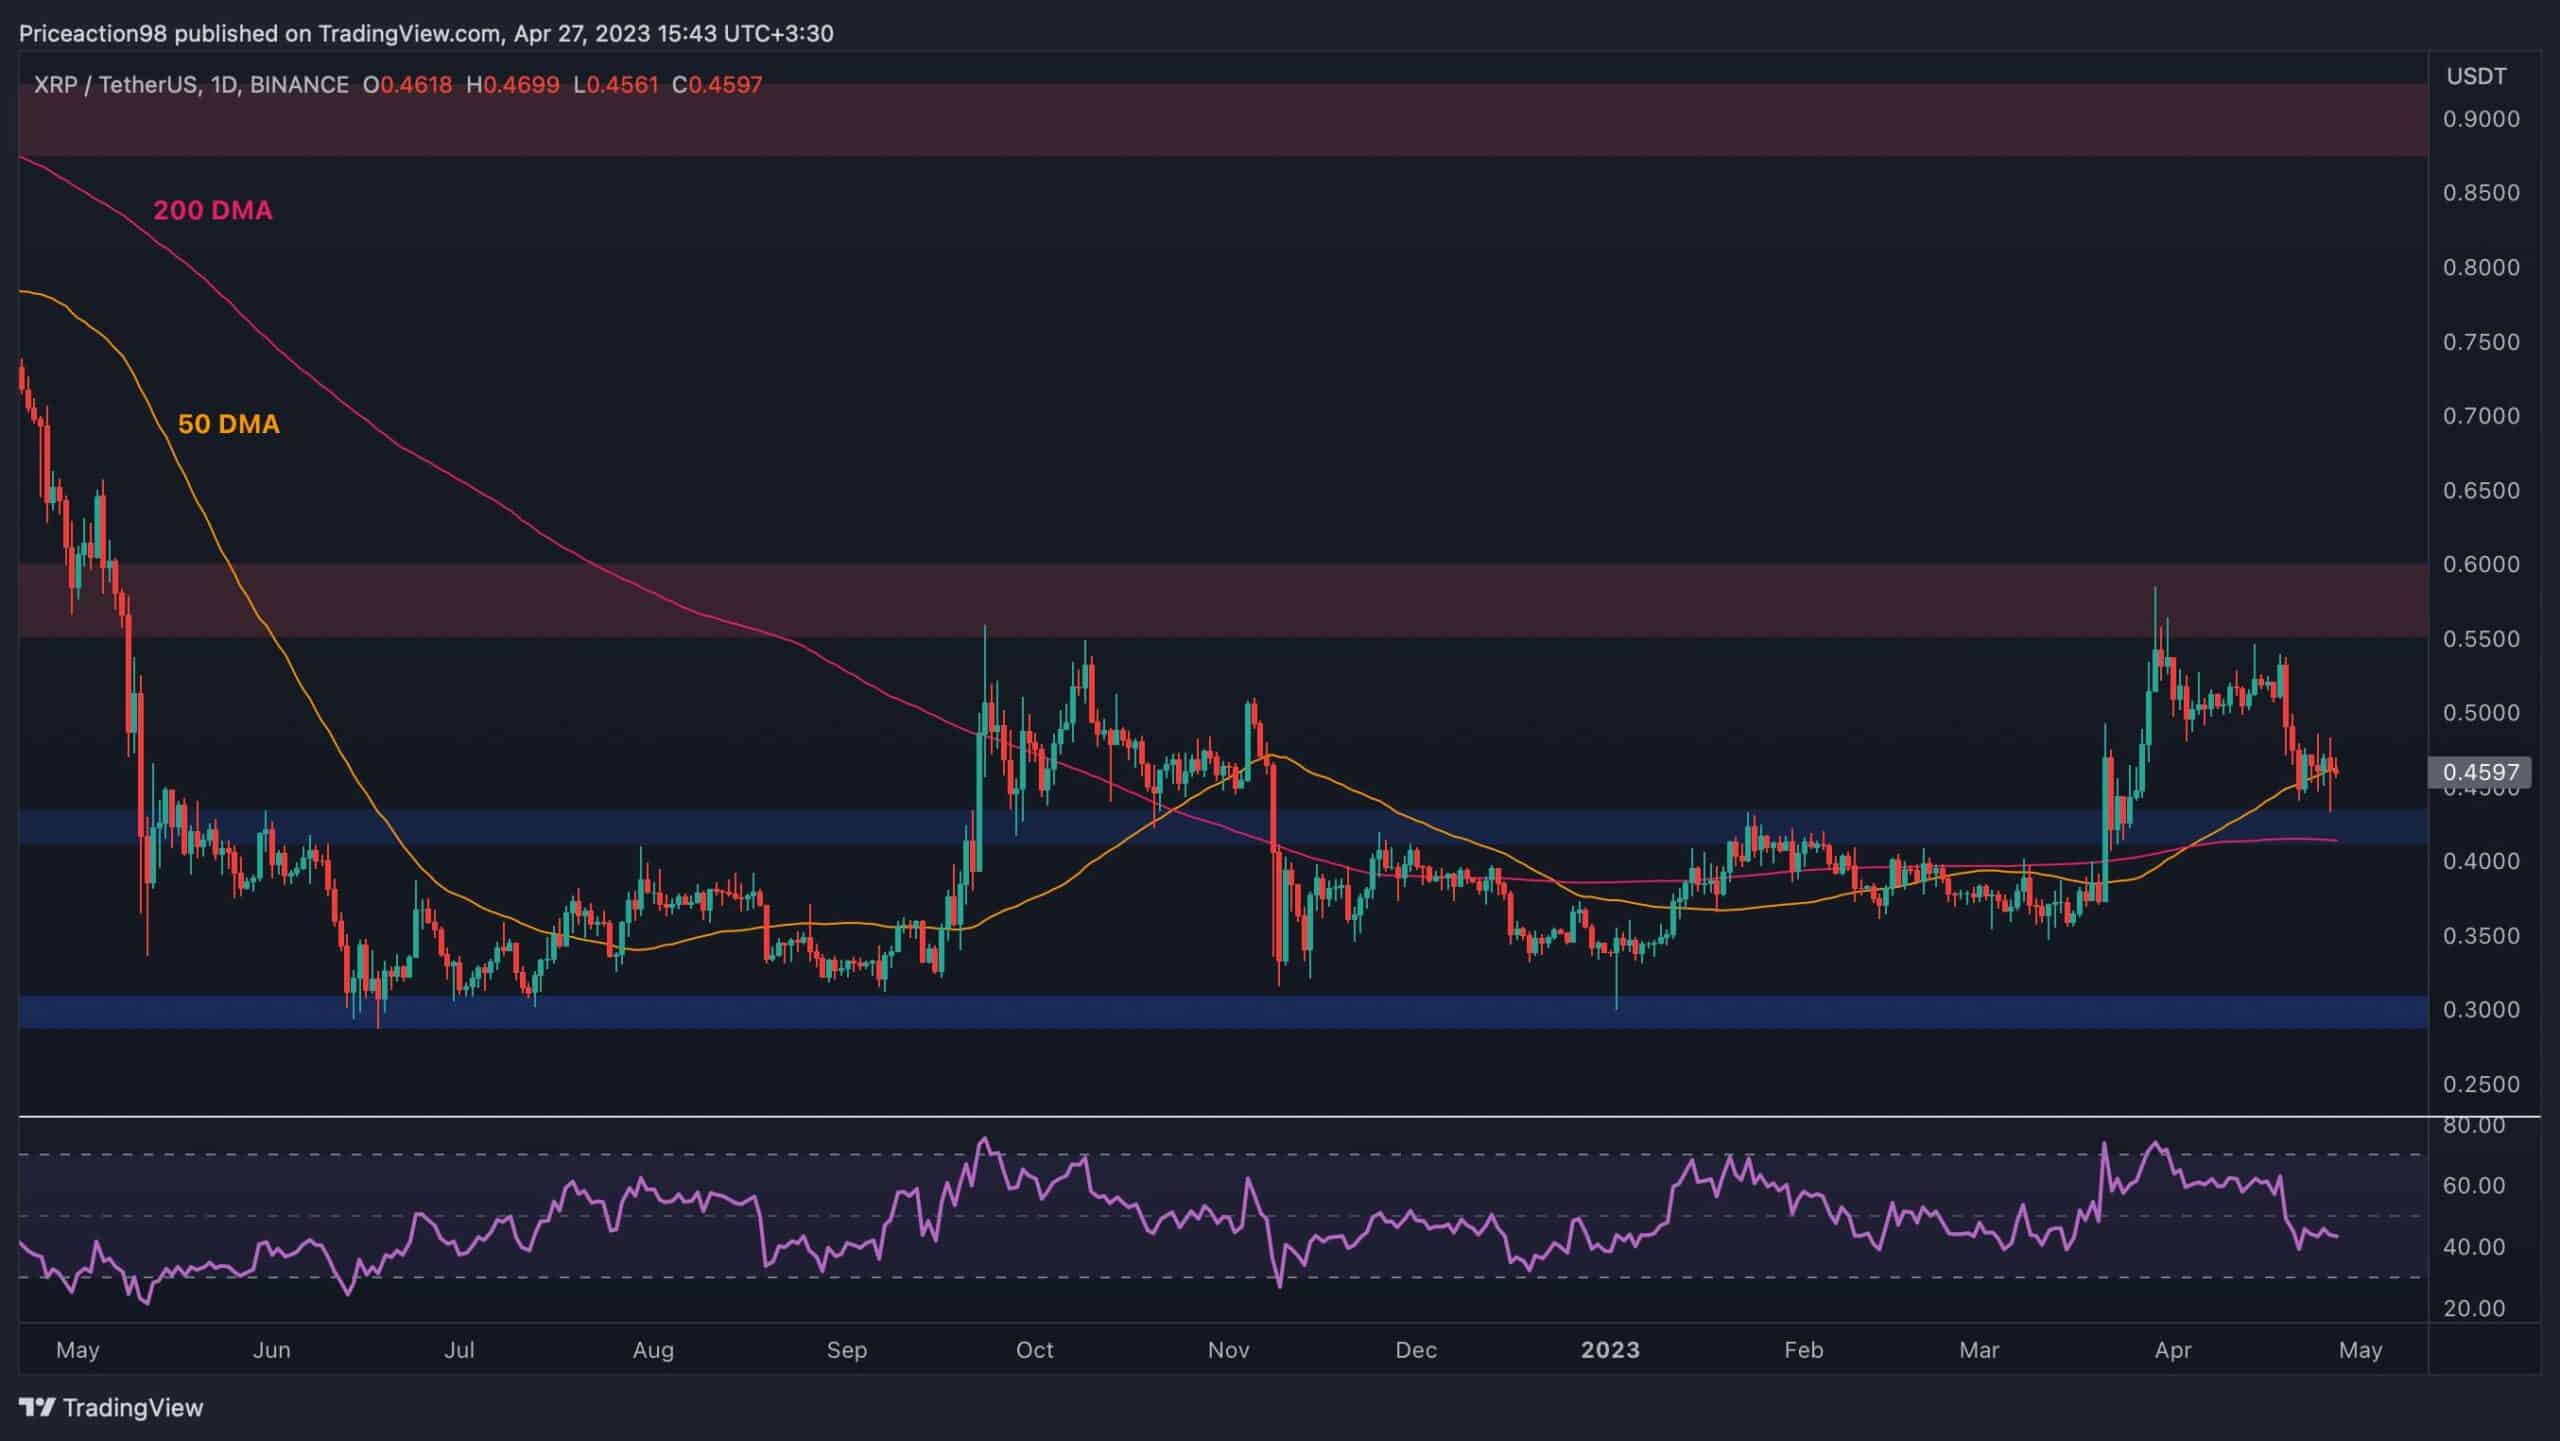
XRP/USDT Daily Chart
XRP’s price failed to break through the $0.55 resistance level and has been dropping since. The 50-day moving average is currently providing support near the $0.46 mark and is closely followed by the 200-day moving average at around $0.41.
This confluence of support elements makes the $0.40 level significantly important, and a break below would likely lead to a rapid drop toward the $0.3 mark in the coming weeks.
On the other hand, a rebound from this area would pave the way for another test of the $0.5 resistance zone, with a higher probability for a bullish breakout this time around.
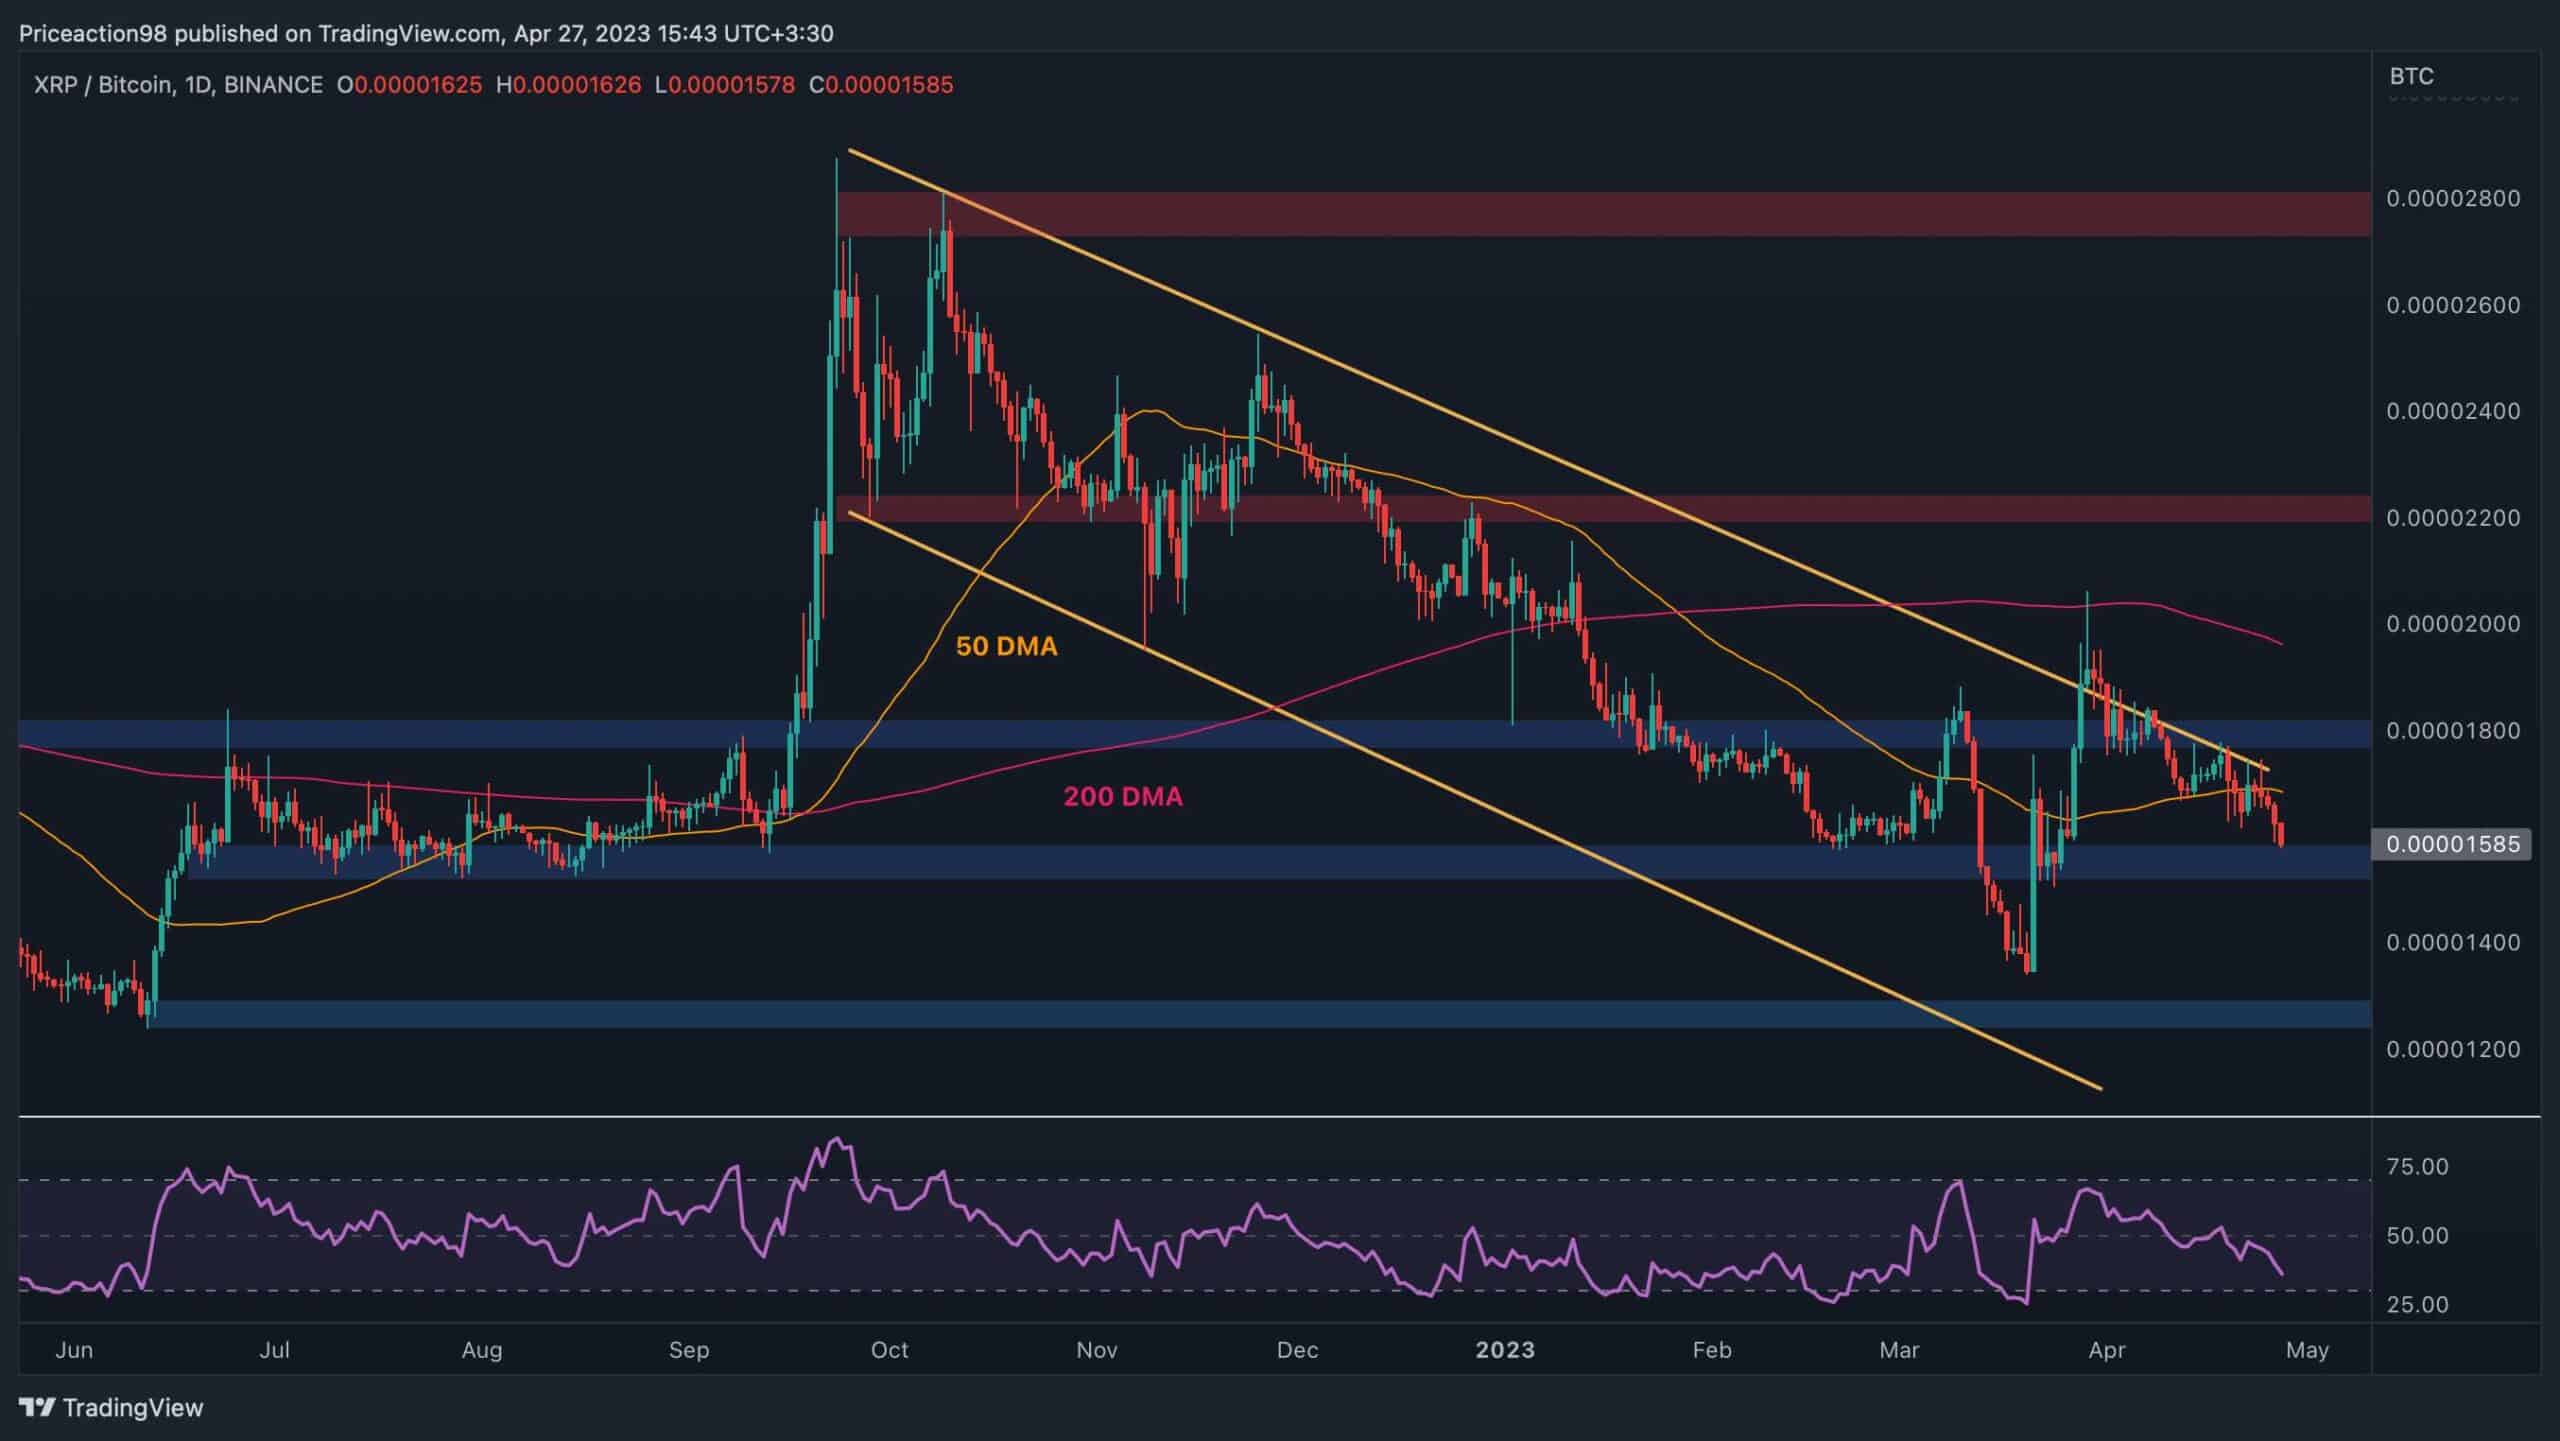
XRP/BTC Daily Chart
Things do not look much better against BTC, as the price has been rejected from the higher boundary of the large descending channel on multiple occasions. The 0.000015 area is being tested at the moment, and a break below it would prove disastrous for the bulls, as there is not much support below before the 0.000013 mark.
The RSI is also indicating bearish momentum dominance by demonstrating values below 50%. Therefore, a bearish continuation seems highly likely for Ripple on the BTC paired chart.