Ripple’s price has remained dormant over the last couple of days, trading within the narrow range of %excerpt%.42 and %excerpt%.31 and struggling to break out. A slight decline towards the lower end of the range seems likely, given that the cryptocurrency was recently rejected at a crucial resistance level. Technical Analysis By Shayan The Daily Chart Ripple’s price has shown signs of weakness, printing small candles with no specific direction. Most recently, the price attempted to claim the descending trendline at %excerpt%.433 and failed. However, due to the rejection, the price dropped below a significant level, the 200-day moving average, which delivers a bearish bias for the cryptocurrency. Yet, Ripple retested the broken moving average and formed a pullback, confirming that the trend has
Topics:
CryptoVizArt considers the following as important: Ripple (XRP) Price, XRP Analysis, xrpbtc, xrpusd
This could be interesting, too:
Jordan Lyanchev writes Ripple’s (XRP) Surge to Triggers Over Million in Short Liquidations
Jordan Lyanchev writes Trump Confirms Work on Strategic Crypto Reserve: XRP, ADA, SOL Included
Dimitar Dzhondzhorov writes Is a Major Ripple v. SEC Lawsuit Development Expected This Week? Here’s Why
Mandy Williams writes Ripple Releases Institutional DeFi Roadmap for XRP Ledger in 2025
Ripple’s price has remained dormant over the last couple of days, trading within the narrow range of $0.42 and $0.31 and struggling to break out. A slight decline towards the lower end of the range seems likely, given that the cryptocurrency was recently rejected at a crucial resistance level.
Technical Analysis
By Shayan
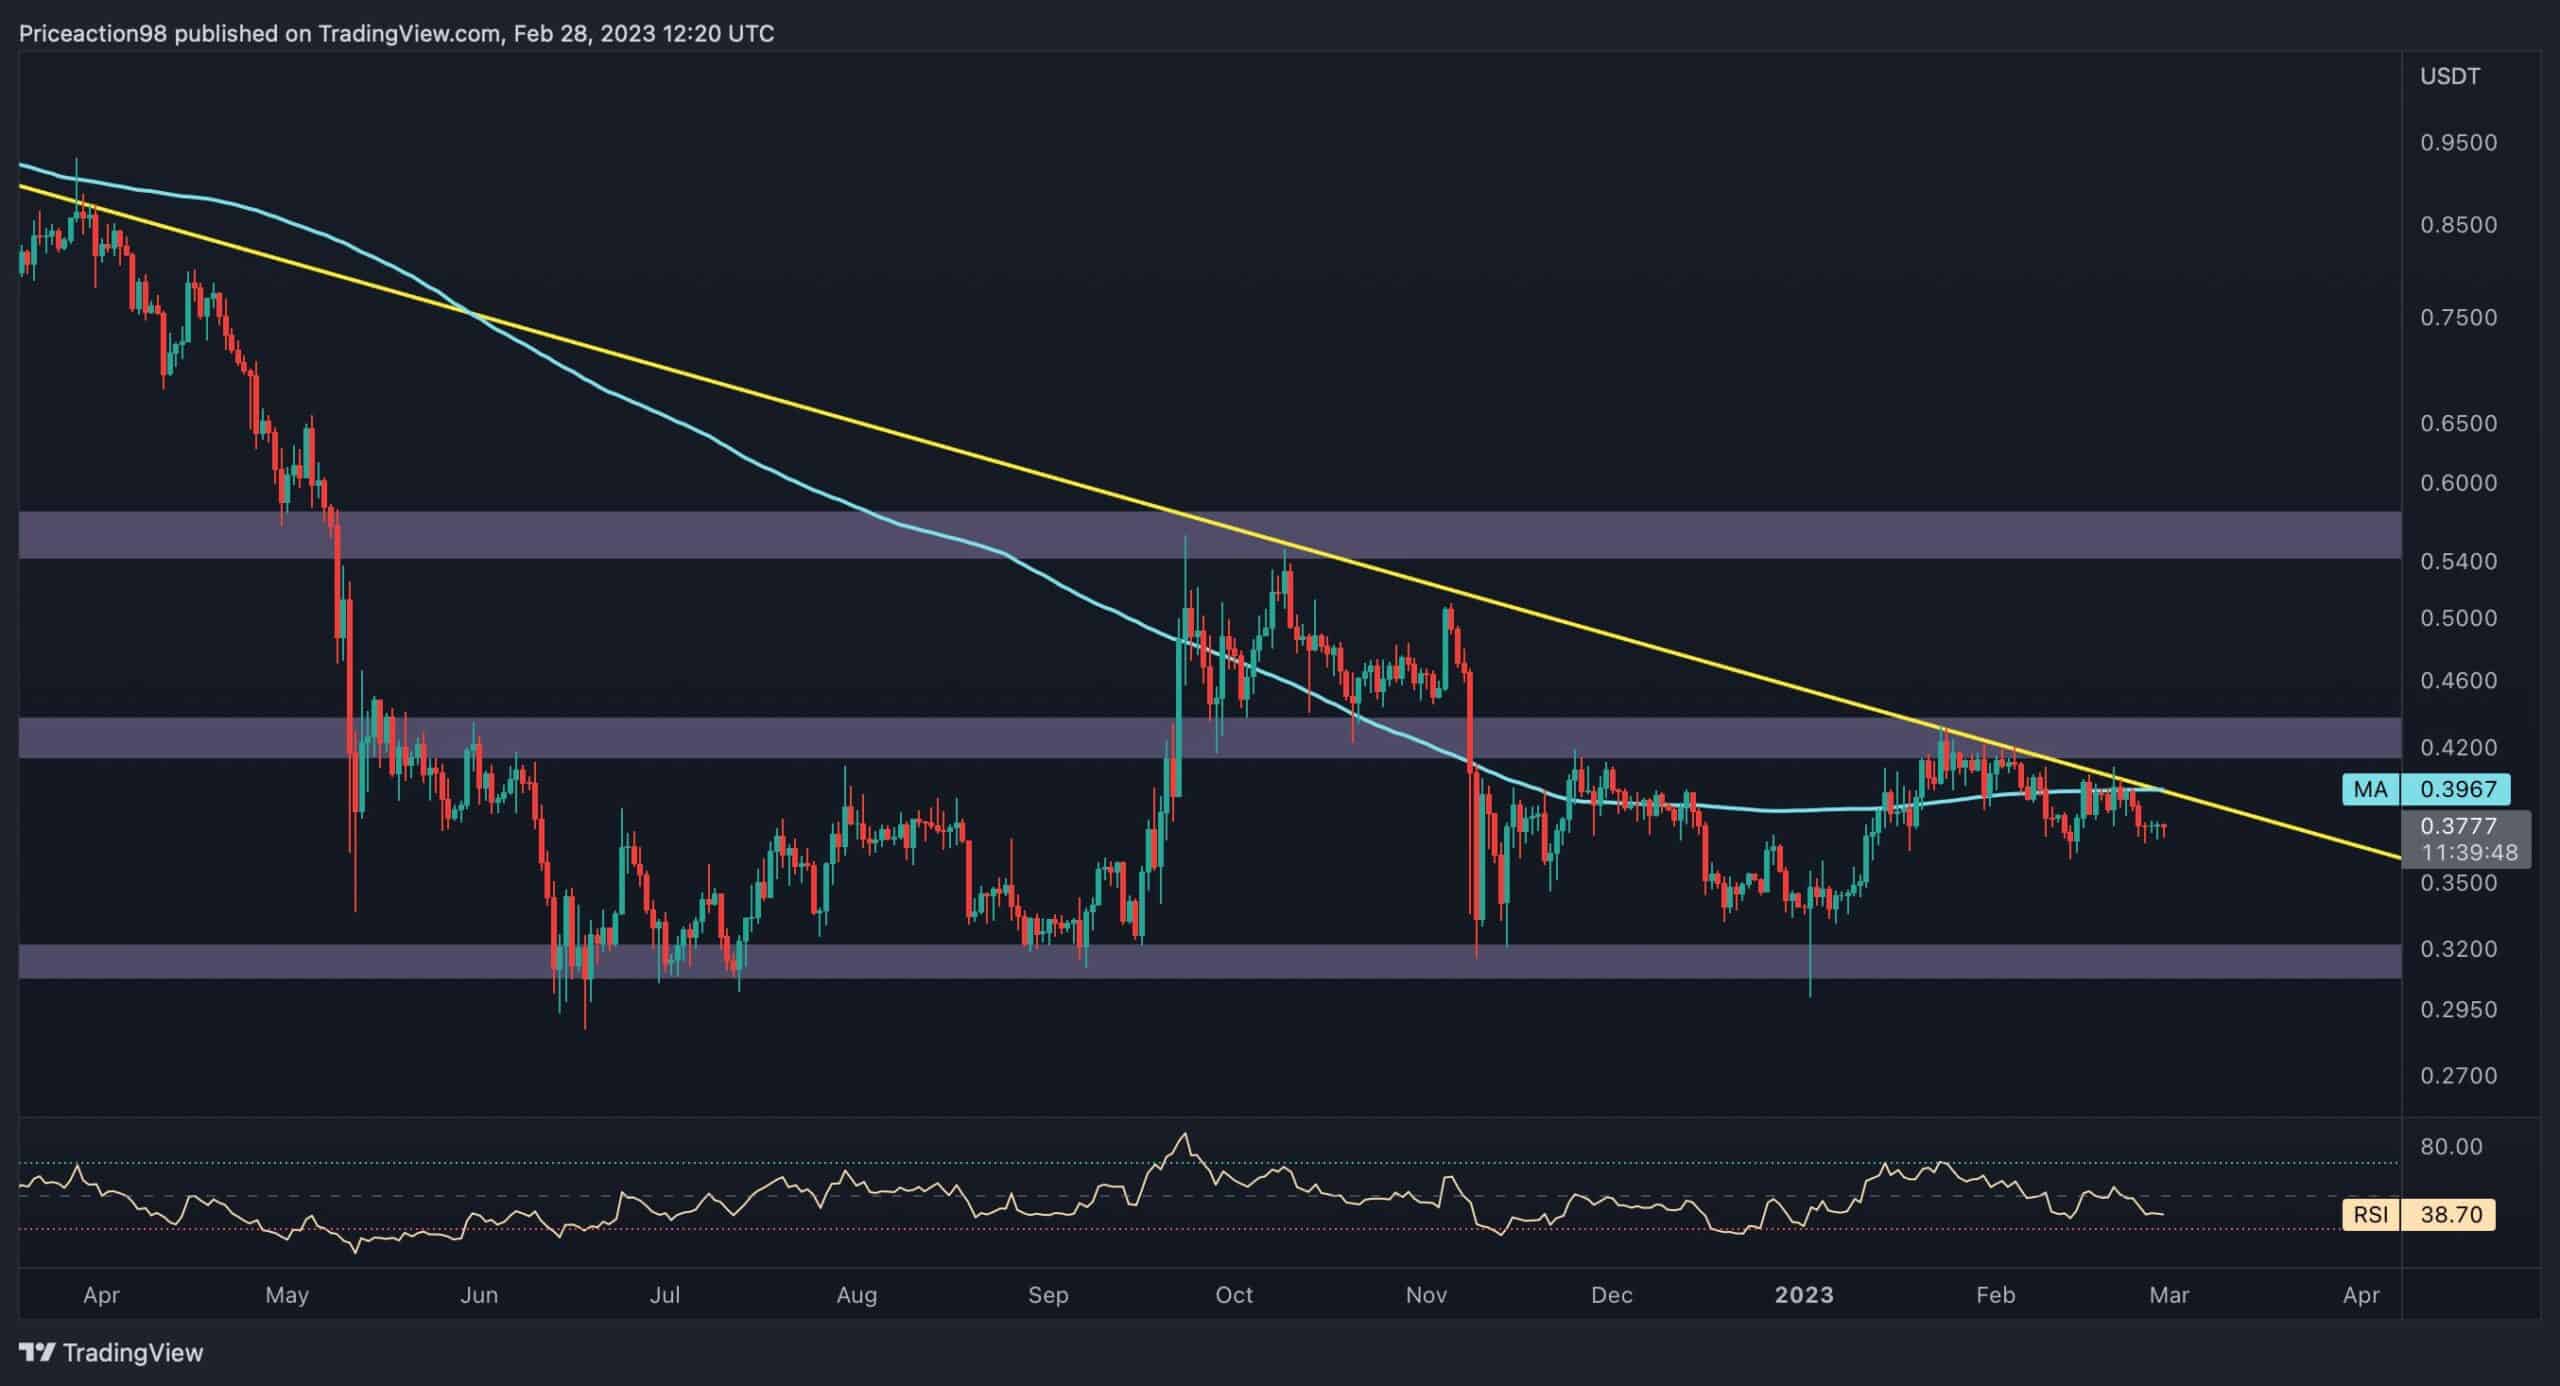
The Daily Chart
Ripple’s price has shown signs of weakness, printing small candles with no specific direction. Most recently, the price attempted to claim the descending trendline at $0.433 and failed.
However, due to the rejection, the price dropped below a significant level, the 200-day moving average, which delivers a bearish bias for the cryptocurrency. Yet, Ripple retested the broken moving average and formed a pullback, confirming that the trend has turned bearish until the price reclaims the level.
Nevertheless, in case of a bearish rally, $0.32 will act as the main support for the price and needs to be monitored.
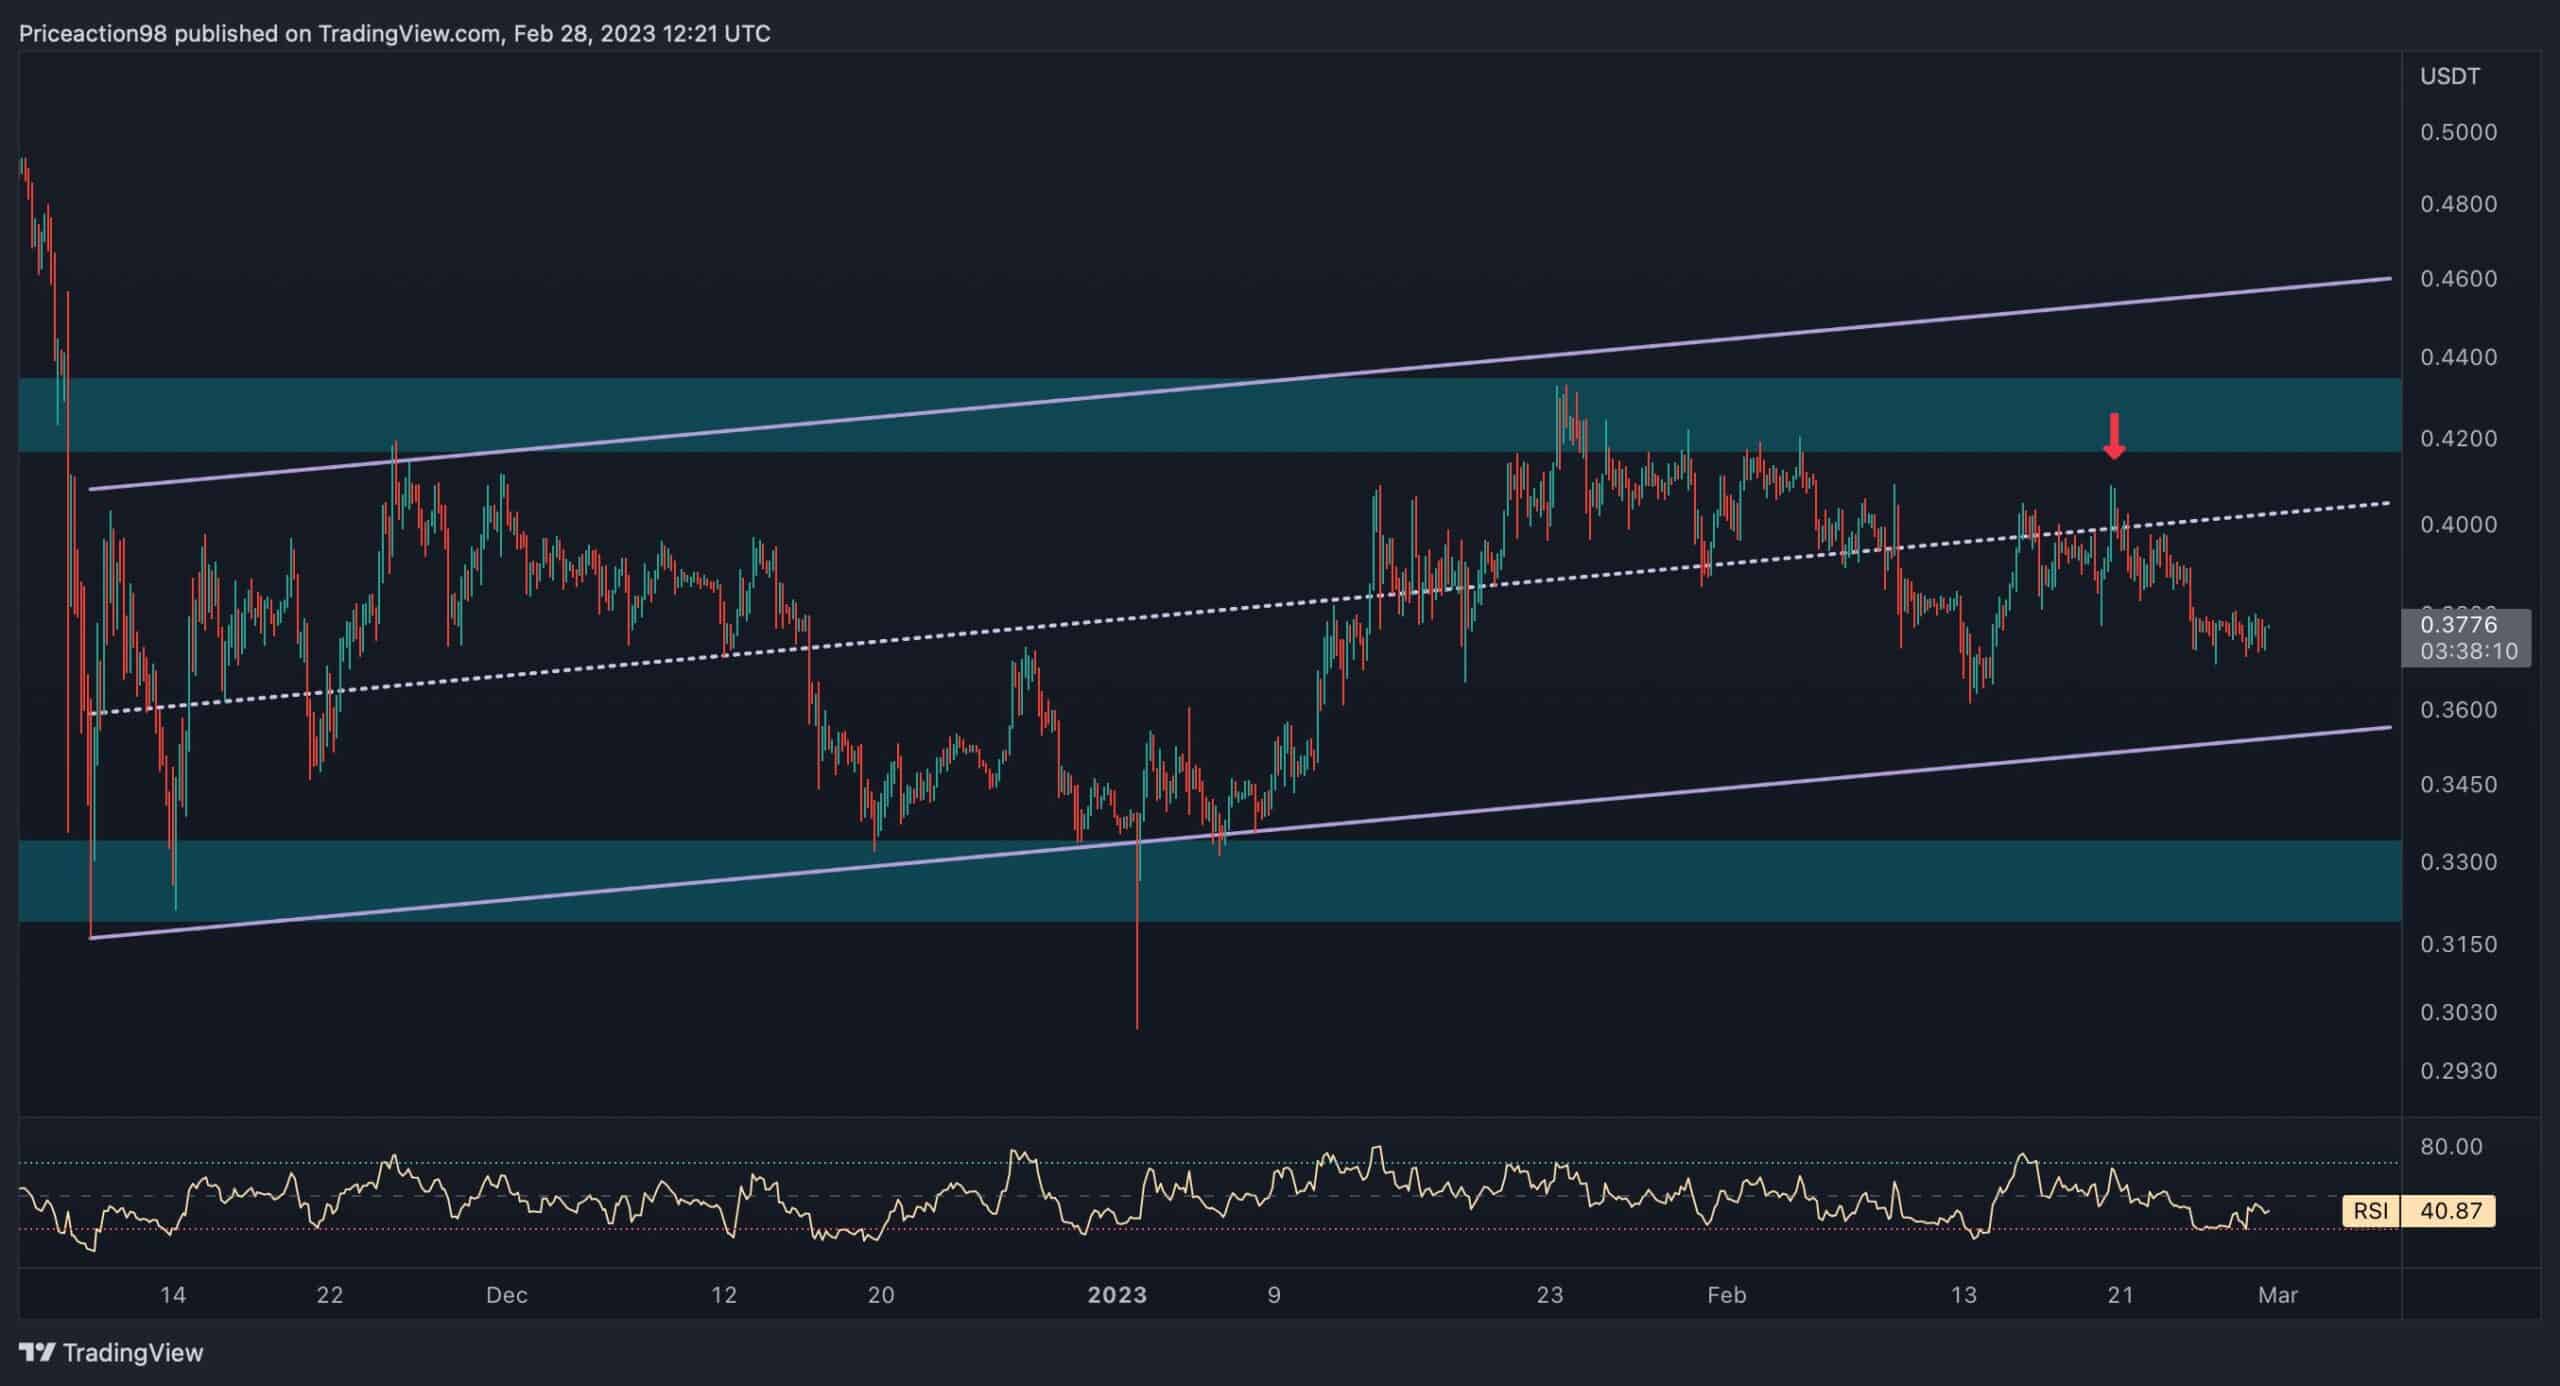
The 4-Hour Chart
As the chart illustrates, XRP plunged below the multi-month ascending price channel’s mid-boundary and formed a pullback to retest it. A pullback to a broken level is essential to confirm the breakout and the continuation of the trend.
Hence, it can be considered that Ripple’s outlook is currently bearish, followed by low volatility in its price. This scenario will change if the cryptocurrency breaks a significant level, returning sufficient demand and trade volume.
Nevertheless, Ripple’s next support will be the channel’s lower trendline and the $0.31 substantial level after that.