Ripple’s price has been declining over the last few weeks, with two significant moving average lines broken to the downside. The price could drop deeper in the coming days, as things are not looking good from a technical analysis aspect. Technical Analysis By: Edris XRP/USDT Daily Chart Looking at the USDT chart, the price has been rejected from the significant %excerpt%.43 area and has broken both the 50-day and 200-day moving average lines to the downside, which are both located around the %excerpt%.4 level. Currently, the market is showing a high willingness to drop toward the key %excerpt%.3 level, where the current bear market’s lowest low sits. Therefore, a breakdown of this area would be disastrous for buyers, as it would further elongate the bear market. The RSI indicator has also
Topics:
CryptoVizArt considers the following as important: Ripple (XRP) Price, XRP Analysis, xrpbtc, xrpusd
This could be interesting, too:
Jordan Lyanchev writes Ripple’s (XRP) Surge to Triggers Over Million in Short Liquidations
Jordan Lyanchev writes Trump Confirms Work on Strategic Crypto Reserve: XRP, ADA, SOL Included
Dimitar Dzhondzhorov writes Is a Major Ripple v. SEC Lawsuit Development Expected This Week? Here’s Why
Mandy Williams writes Ripple Releases Institutional DeFi Roadmap for XRP Ledger in 2025
Ripple’s price has been declining over the last few weeks, with two significant moving average lines broken to the downside. The price could drop deeper in the coming days, as things are not looking good from a technical analysis aspect.
Technical Analysis
By: Edris
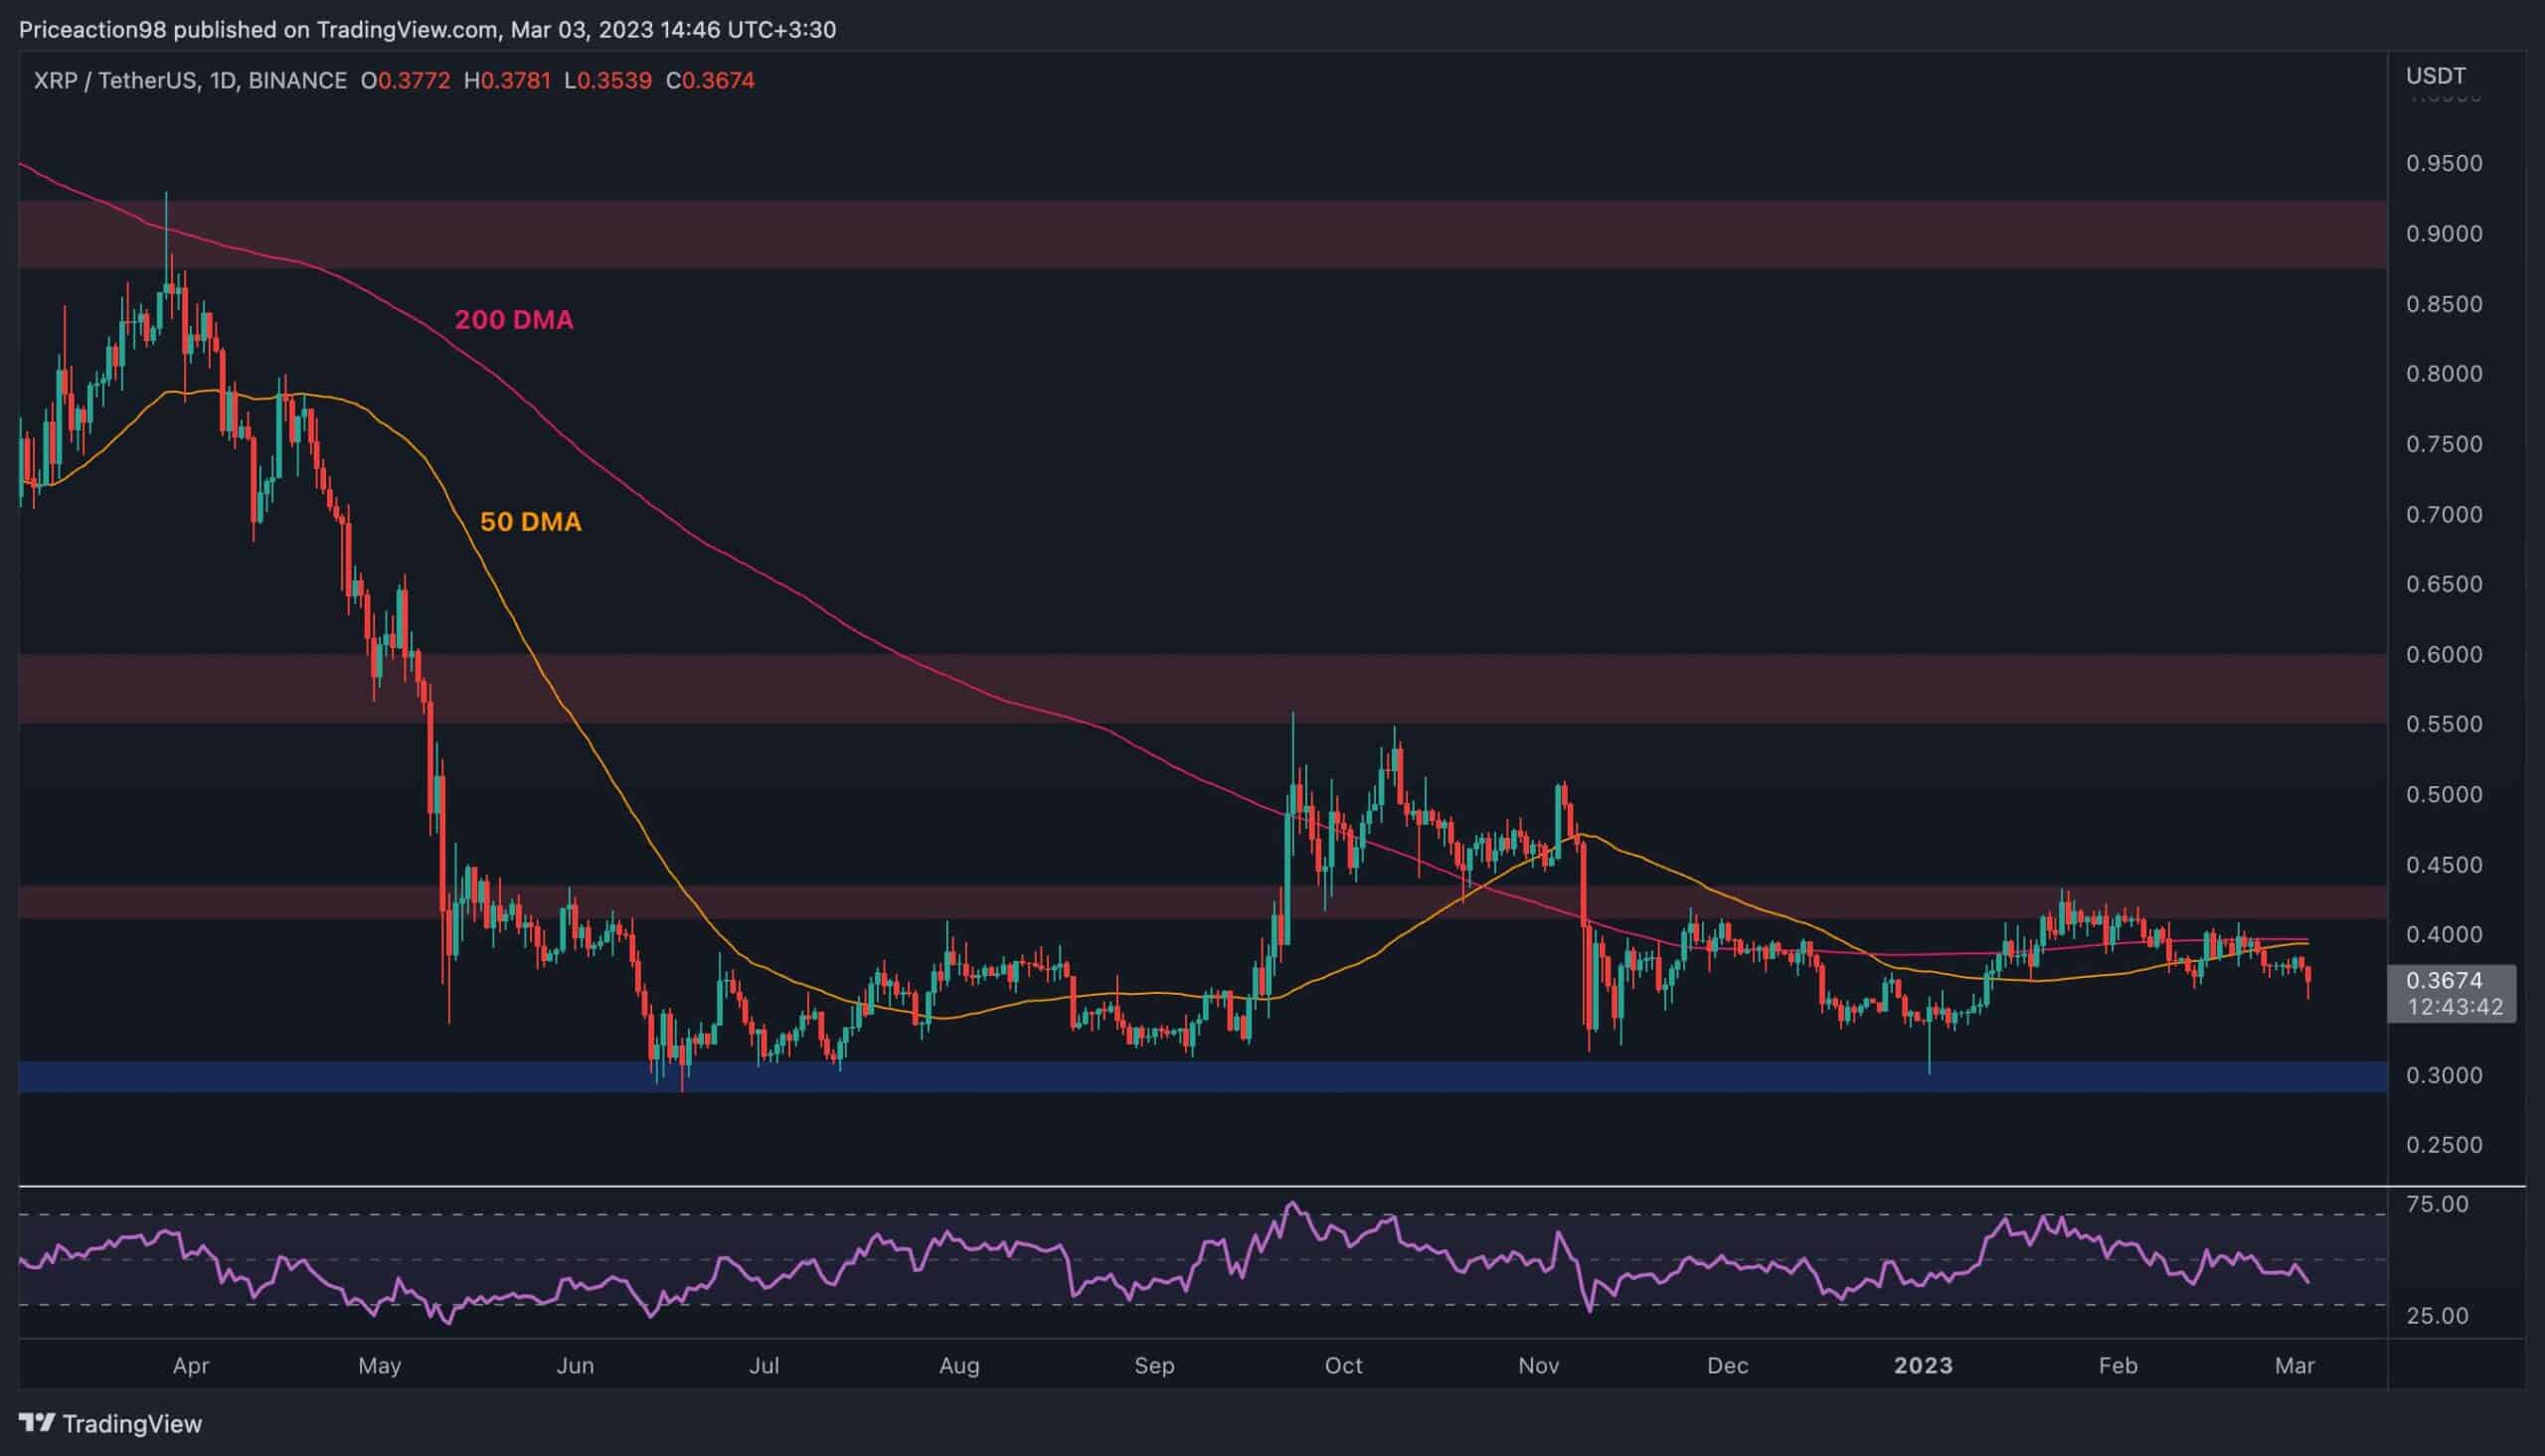
XRP/USDT Daily Chart
Looking at the USDT chart, the price has been rejected from the significant $0.43 area and has broken both the 50-day and 200-day moving average lines to the downside, which are both located around the $0.4 level.
Currently, the market is showing a high willingness to drop toward the key $0.3 level, where the current bear market’s lowest low sits. Therefore, a breakdown of this area would be disastrous for buyers, as it would further elongate the bear market.
The RSI indicator has also dropped below the 50% threshold, demonstrating the current bearish momentum and boosting the likelihood of a deeper decline in the short term.
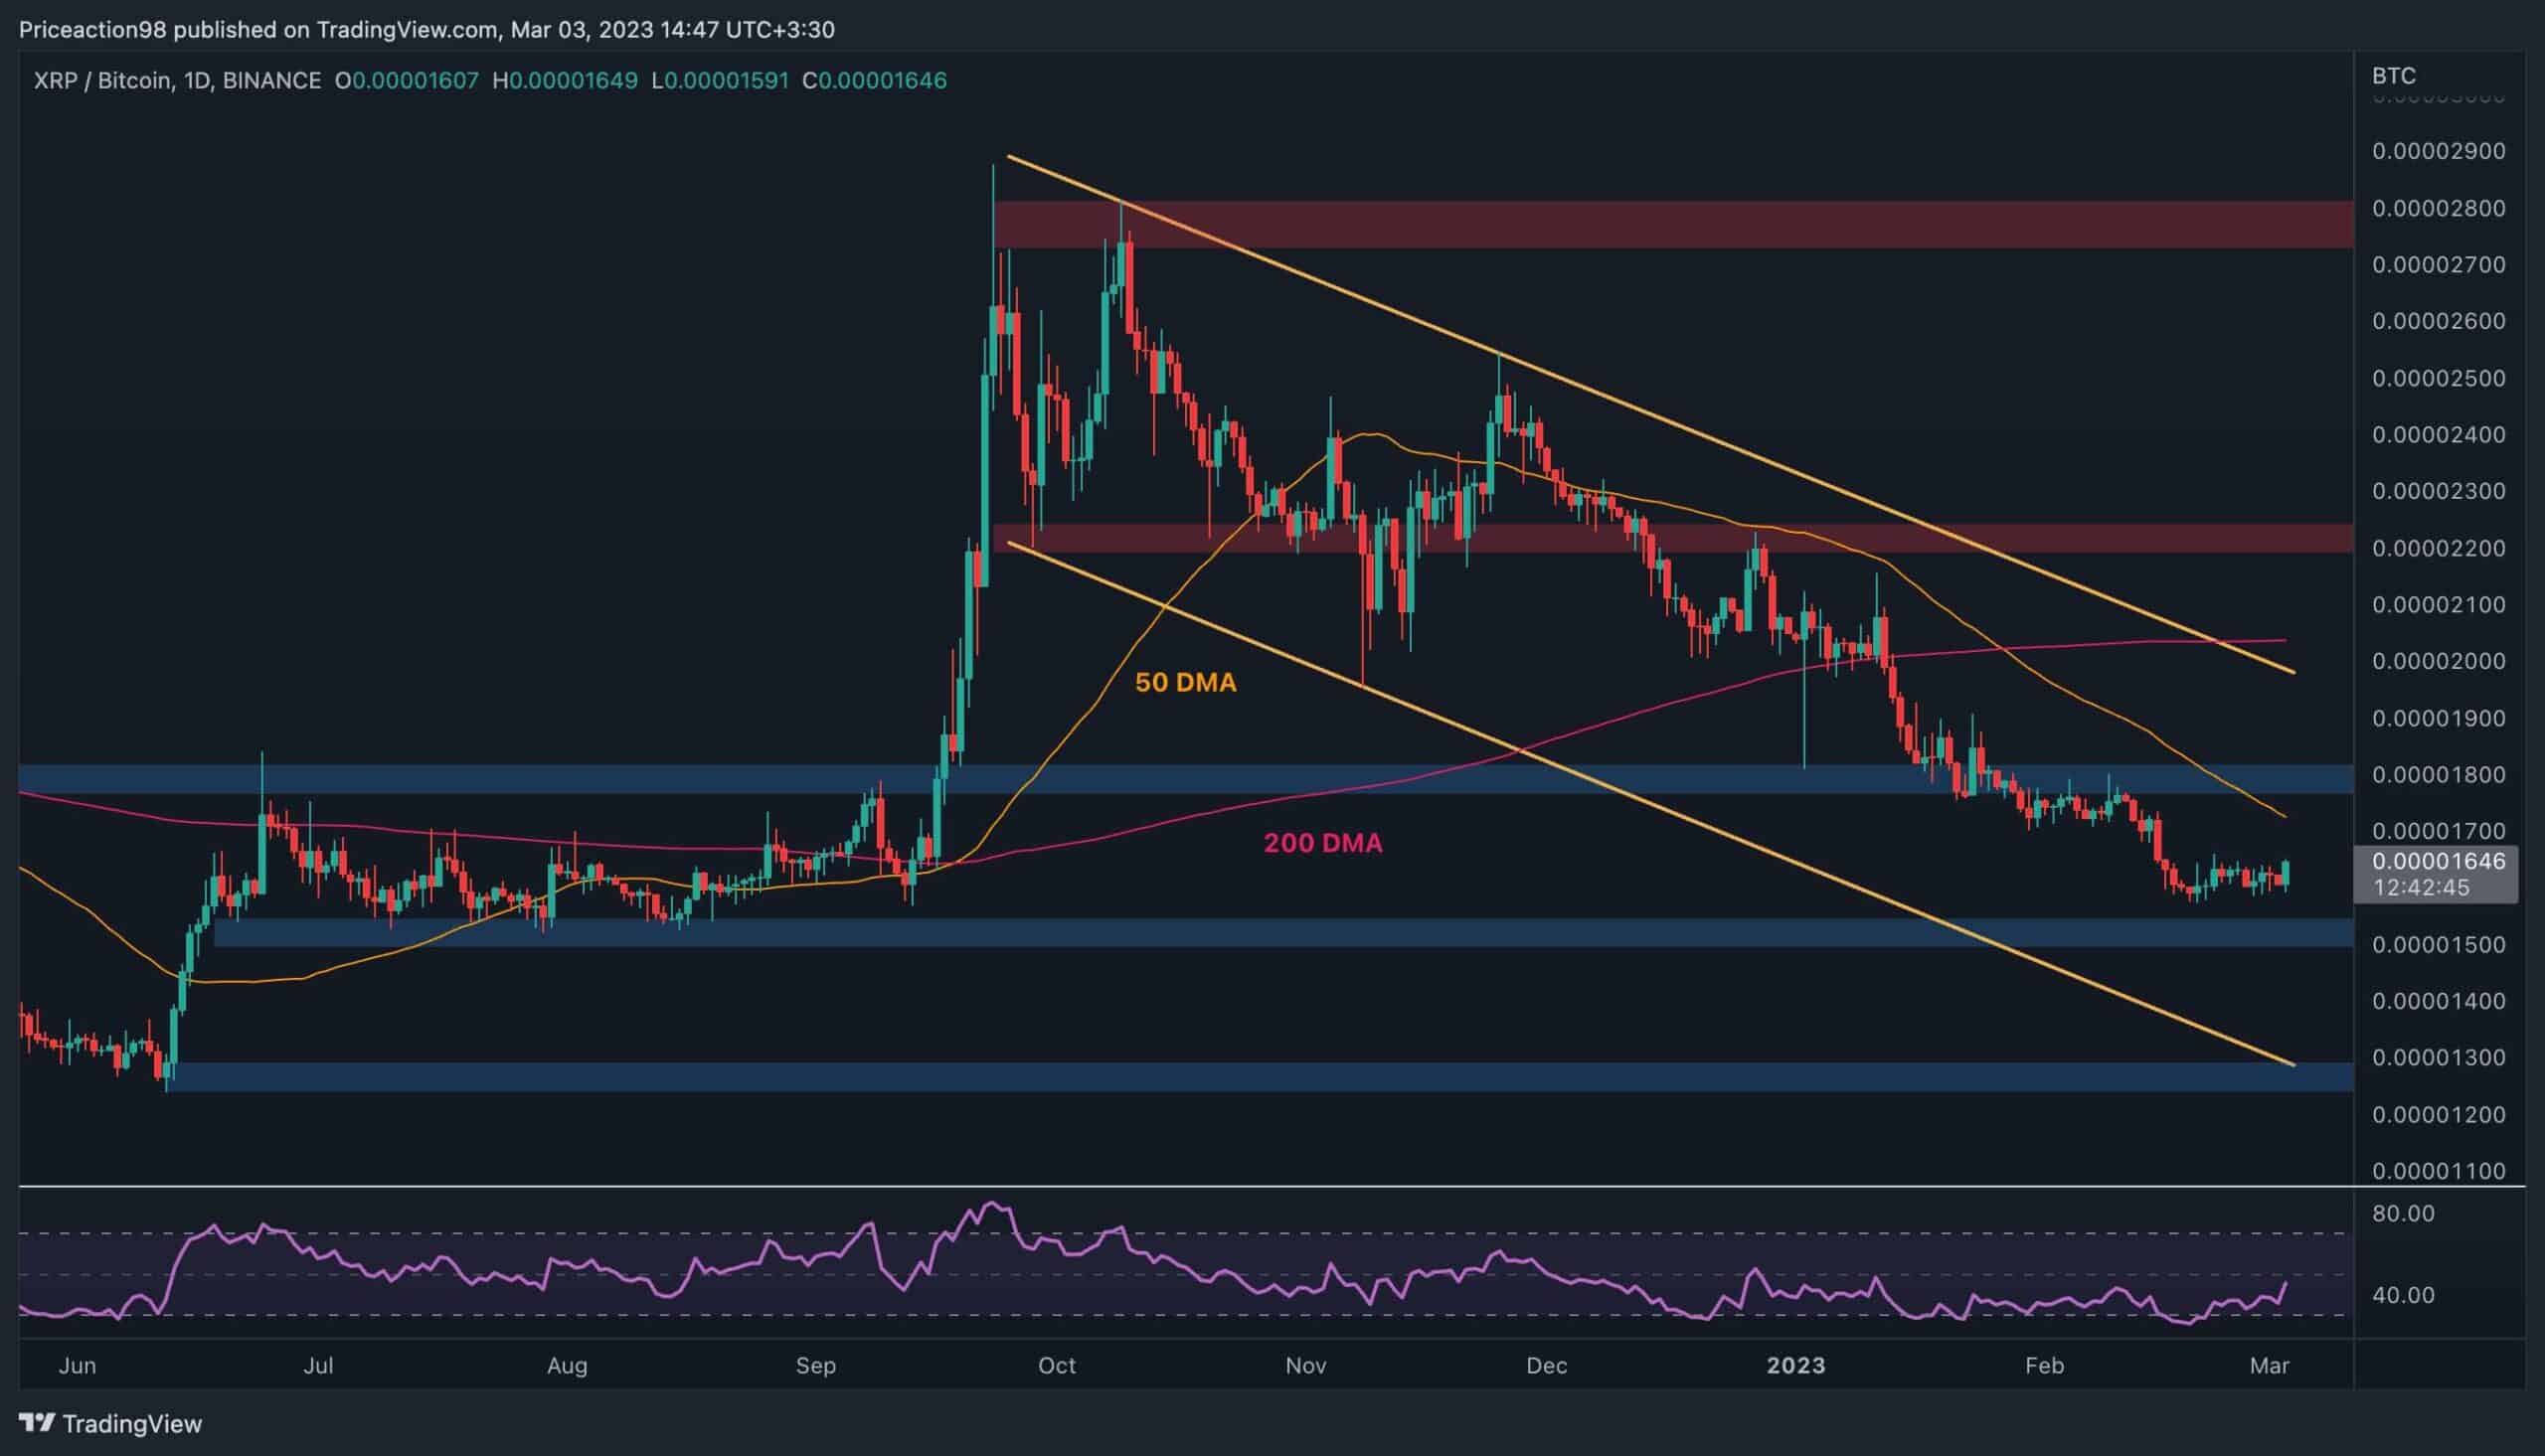
XRP/BTC Daily Chart
Against BTC, things are not looking overly optimistic either, as the market structure is clearly bearish on the daily timeframe. Despite this, the price is currently holding above the 0.000015 level, and the 50-day moving average located around the 0.000017 level could be tested in the next few days in case a rebound occurs.
The bearish price action would still be expected to continue until the 0.000018 resistance level is intact. Moreover, the RSI indicator is on the rise after exiting the oversold zone and is approaching the 50% equilibrium level.
However, with the indicator still below the mentioned threshold, the bears are still in control, and a drop toward the 0.000015 level is still highly probable in the short term.