In today’s overview, we take a closer look at Ethereum, Cardano, Ripple, Binance Coin, and Solana. Ethereum Ethereum might be down 9.1% this week, but it’s recovering well from the latest collapse. The cryptocurrency fell from above ,800 last Friday and continued to decline during the weekend until it found support at the 50-day MA level. It rebounded from the 50-day MA and started to climb throughout the week. Yesterday, it found resistance at the 20-day MA level and the July 2021 lows around ,700. Today, it continues to battle with this resistance. If ETH breaks ,700, resistance is expected at ,800, ,000, and ,200 (200-day MA). On the other side, support is first located at ,600 (50-day MA). This is followed by ,510 (March 2021 lows), ,400 (rising
Topics:
Dimitar Dzhondzhorov considers the following as important: ADABTC, ADAUSD, Binance Coin (BNB) Price, BNBBTC, bnbusd, Cardano (ADA) Price, ETH Analysis, ETHBTC, Ethereum (ETH) Price, ethusd, Price Analysis, Ripple (XRP) Price, Solana (SOL) Price, SOLBTC, SOLUSD, XRP Analysis, xrpbtc, xrpusd
This could be interesting, too:
Jordan Lyanchev writes Ripple’s (XRP) Surge to Triggers Over Million in Short Liquidations
Jordan Lyanchev writes Cardano (ADA) Surpasses Dogecoin After 55% Surge
Jordan Lyanchev writes Trump Confirms Work on Strategic Crypto Reserve: XRP, ADA, SOL Included
Mandy Williams writes Ethereum Derivatives Metrics Signal Modest Downside Tail Risk Ahead: Nansen
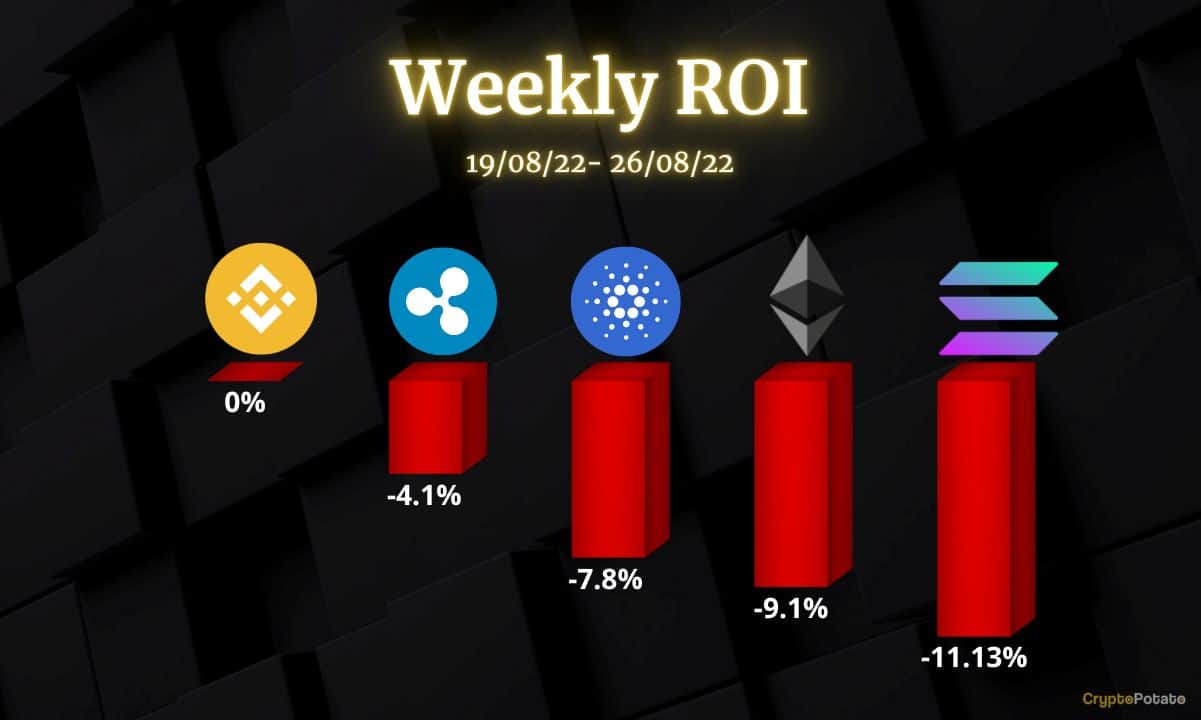
In today’s overview, we take a closer look at Ethereum, Cardano, Ripple, Binance Coin, and Solana.
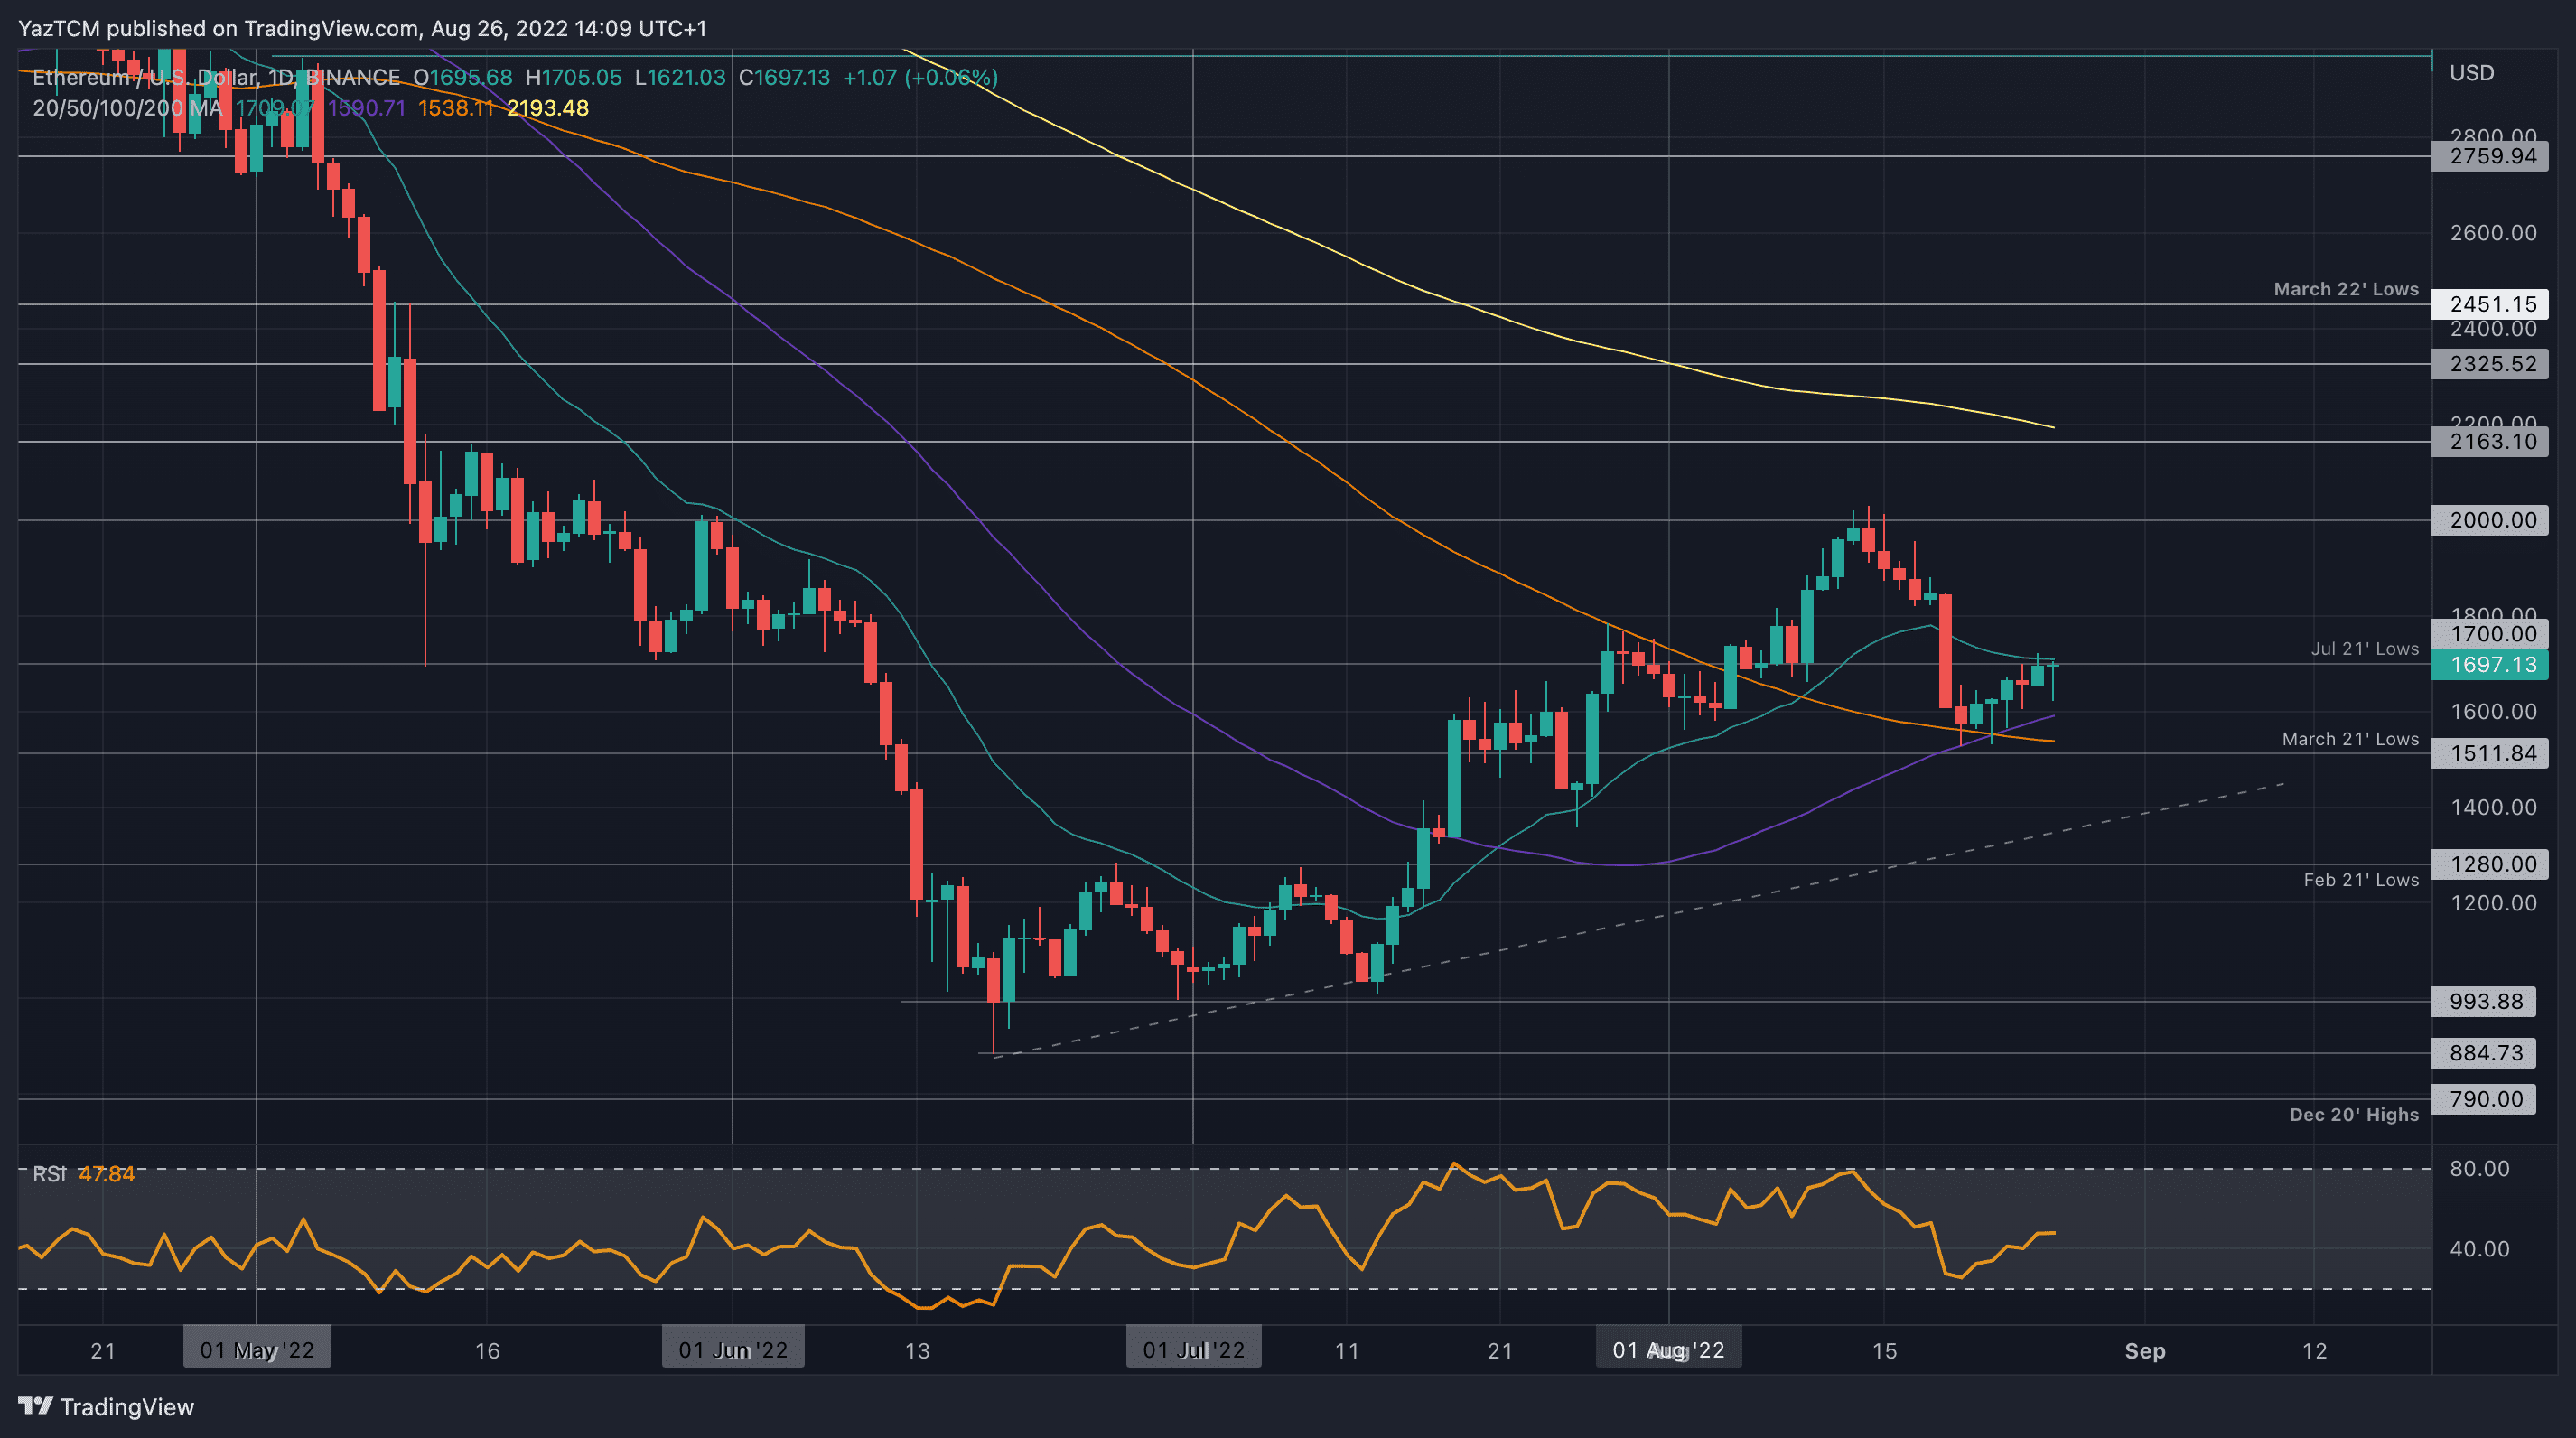
Ethereum
Ethereum might be down 9.1% this week, but it’s recovering well from the latest collapse. The cryptocurrency fell from above $1,800 last Friday and continued to decline during the weekend until it found support at the 50-day MA level.
It rebounded from the 50-day MA and started to climb throughout the week. Yesterday, it found resistance at the 20-day MA level and the July 2021 lows around $1,700. Today, it continues to battle with this resistance.
If ETH breaks $1,700, resistance is expected at $1,800, $2,000, and $2,200 (200-day MA).
On the other side, support is first located at $1,600 (50-day MA). This is followed by $1,510 (March 2021 lows), $1,400 (rising trend line), and $1,280 (Feb 2021 lows).
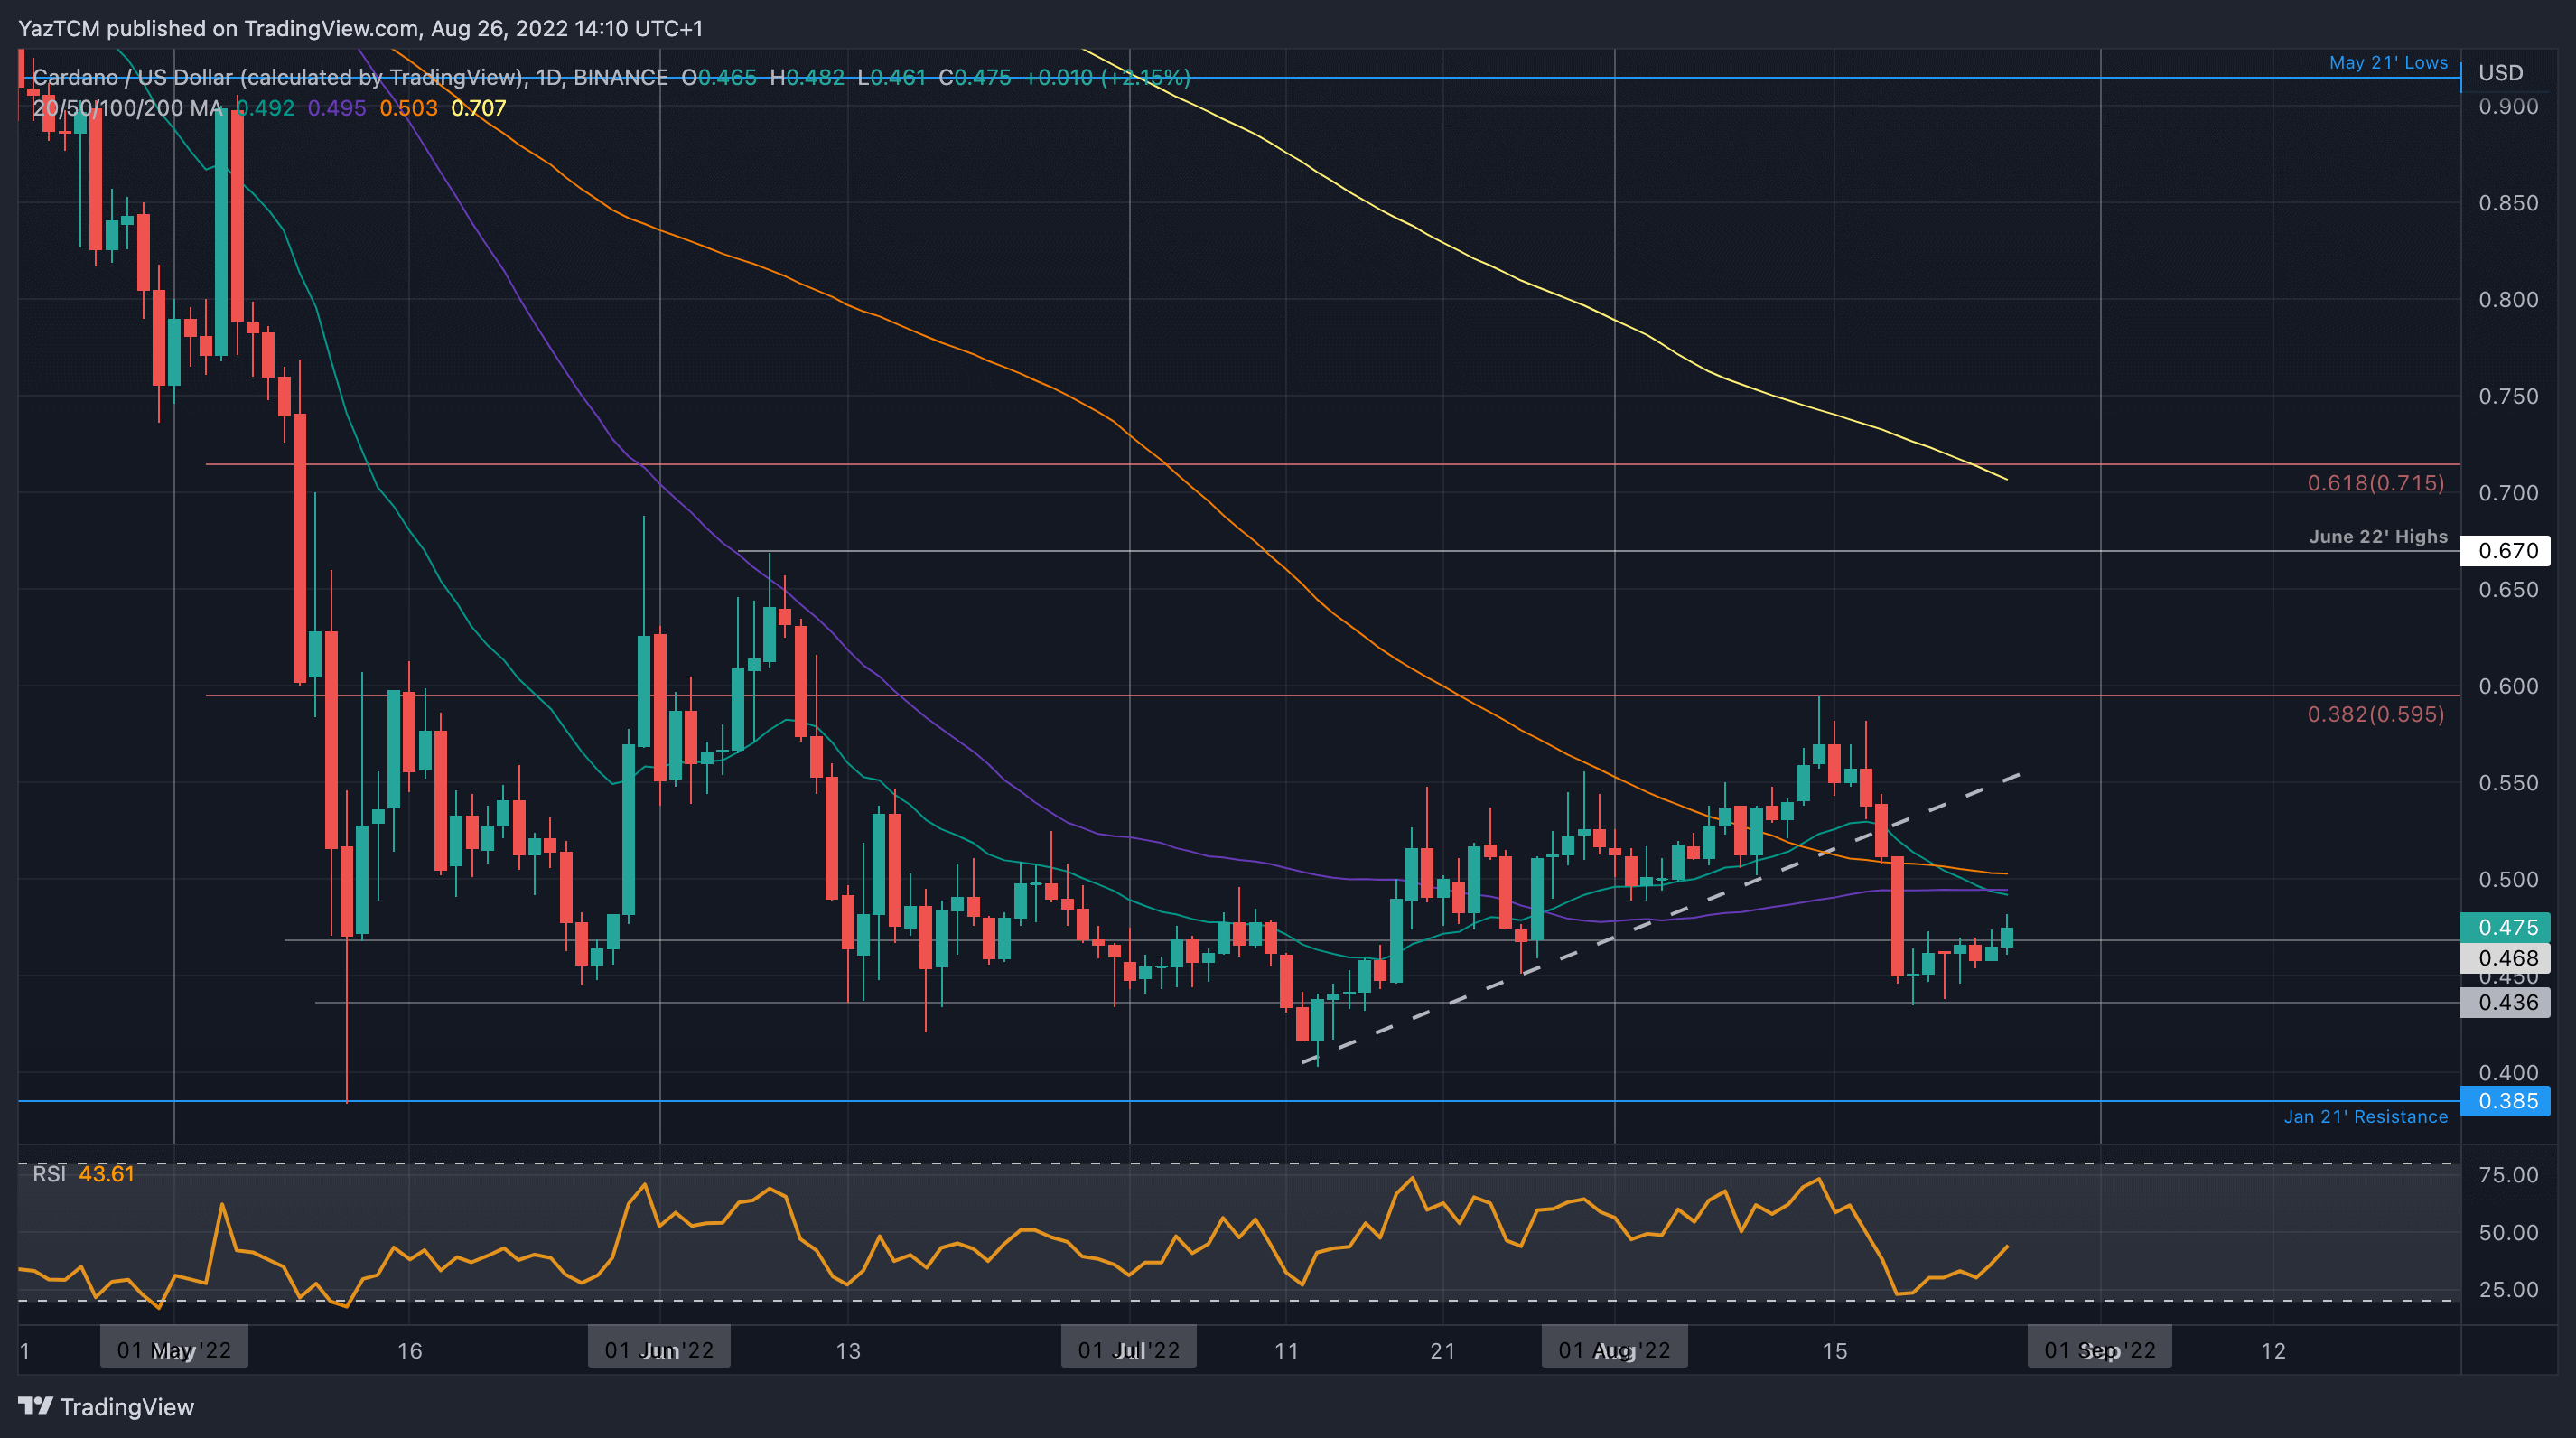
Cardano
ADA is down by 7.8% this week as it trades around $0.475. Last week’s price drop caused ADA to fall beneath a rising trend line and break beneath the 100-day MA. It continued to decline until support was found at $0.436 over the weekend.
Since then, ADA traded inside a range between $0.436 and $0.47 throughout the week. However, today’s 3% price hike allowed it to break this range as it trades above $0.47.
Looking ahead, the first resistance lies at $0.5 (50/100-day MA levels). This is followed by resistance at $0.55, $0.6 (bearish .382 Fib), and $0.64.
On the other side, the first support lies at $0.47. This is followed by $0.45, $0.436, and $0.4.
Ripple
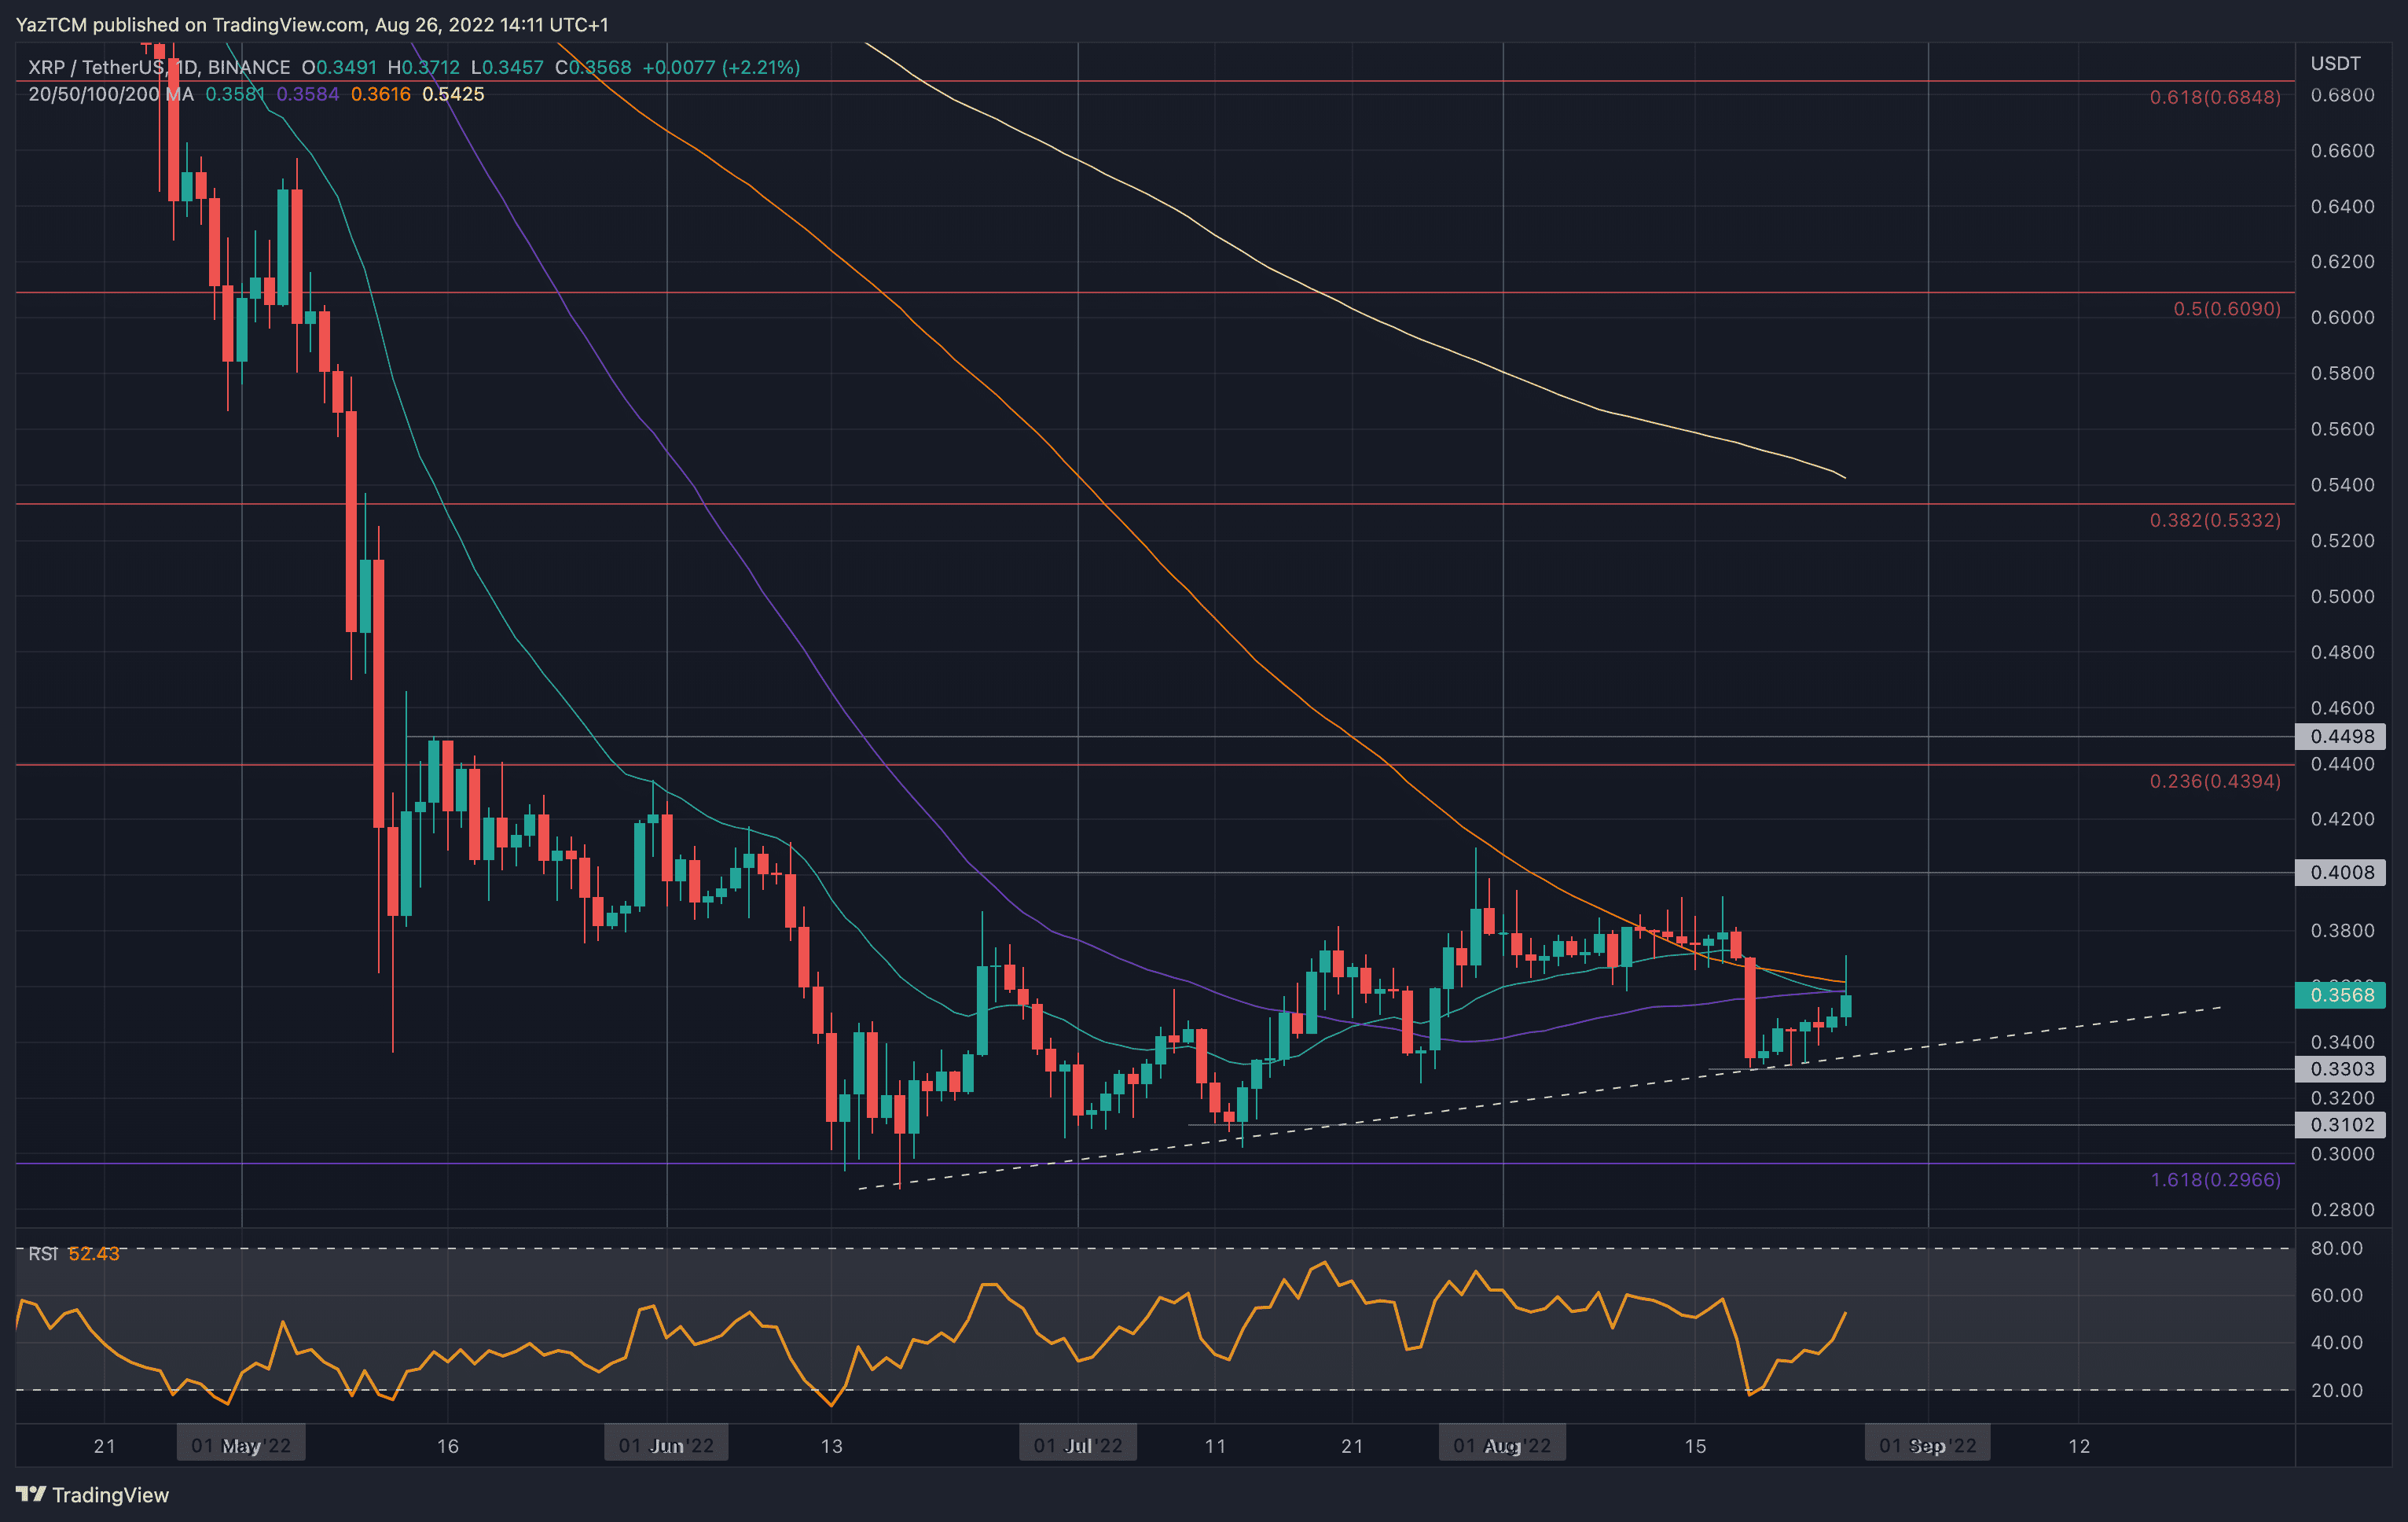
XRP is down by a slight 4% over the week as it trades around $0.36. The cryptocurrency dropped as low as $0.33 last Friday but quickly found support at a rising trend line. From there, it started to grind higher over the week as it broke back above $0.34.
Today, XRP witnessed a 3% surge that allowed it to reach $0.36. In fact, XRP pushed as high as $0.371 today but retreated as it struggled with the 50/100-day MA levels at $0.36.
Looking ahead, if the bulls can produce a daily closing candle above $0.36, the first resistance is expected at $0.38. This is followed by $0.4, $0.42, and $0.44 (bearish .236 Fib).
On the other side, support is first located at $0.35. This is followed by $0.34, the rising trend line, $0.33, and $0.31.
Binance Coin
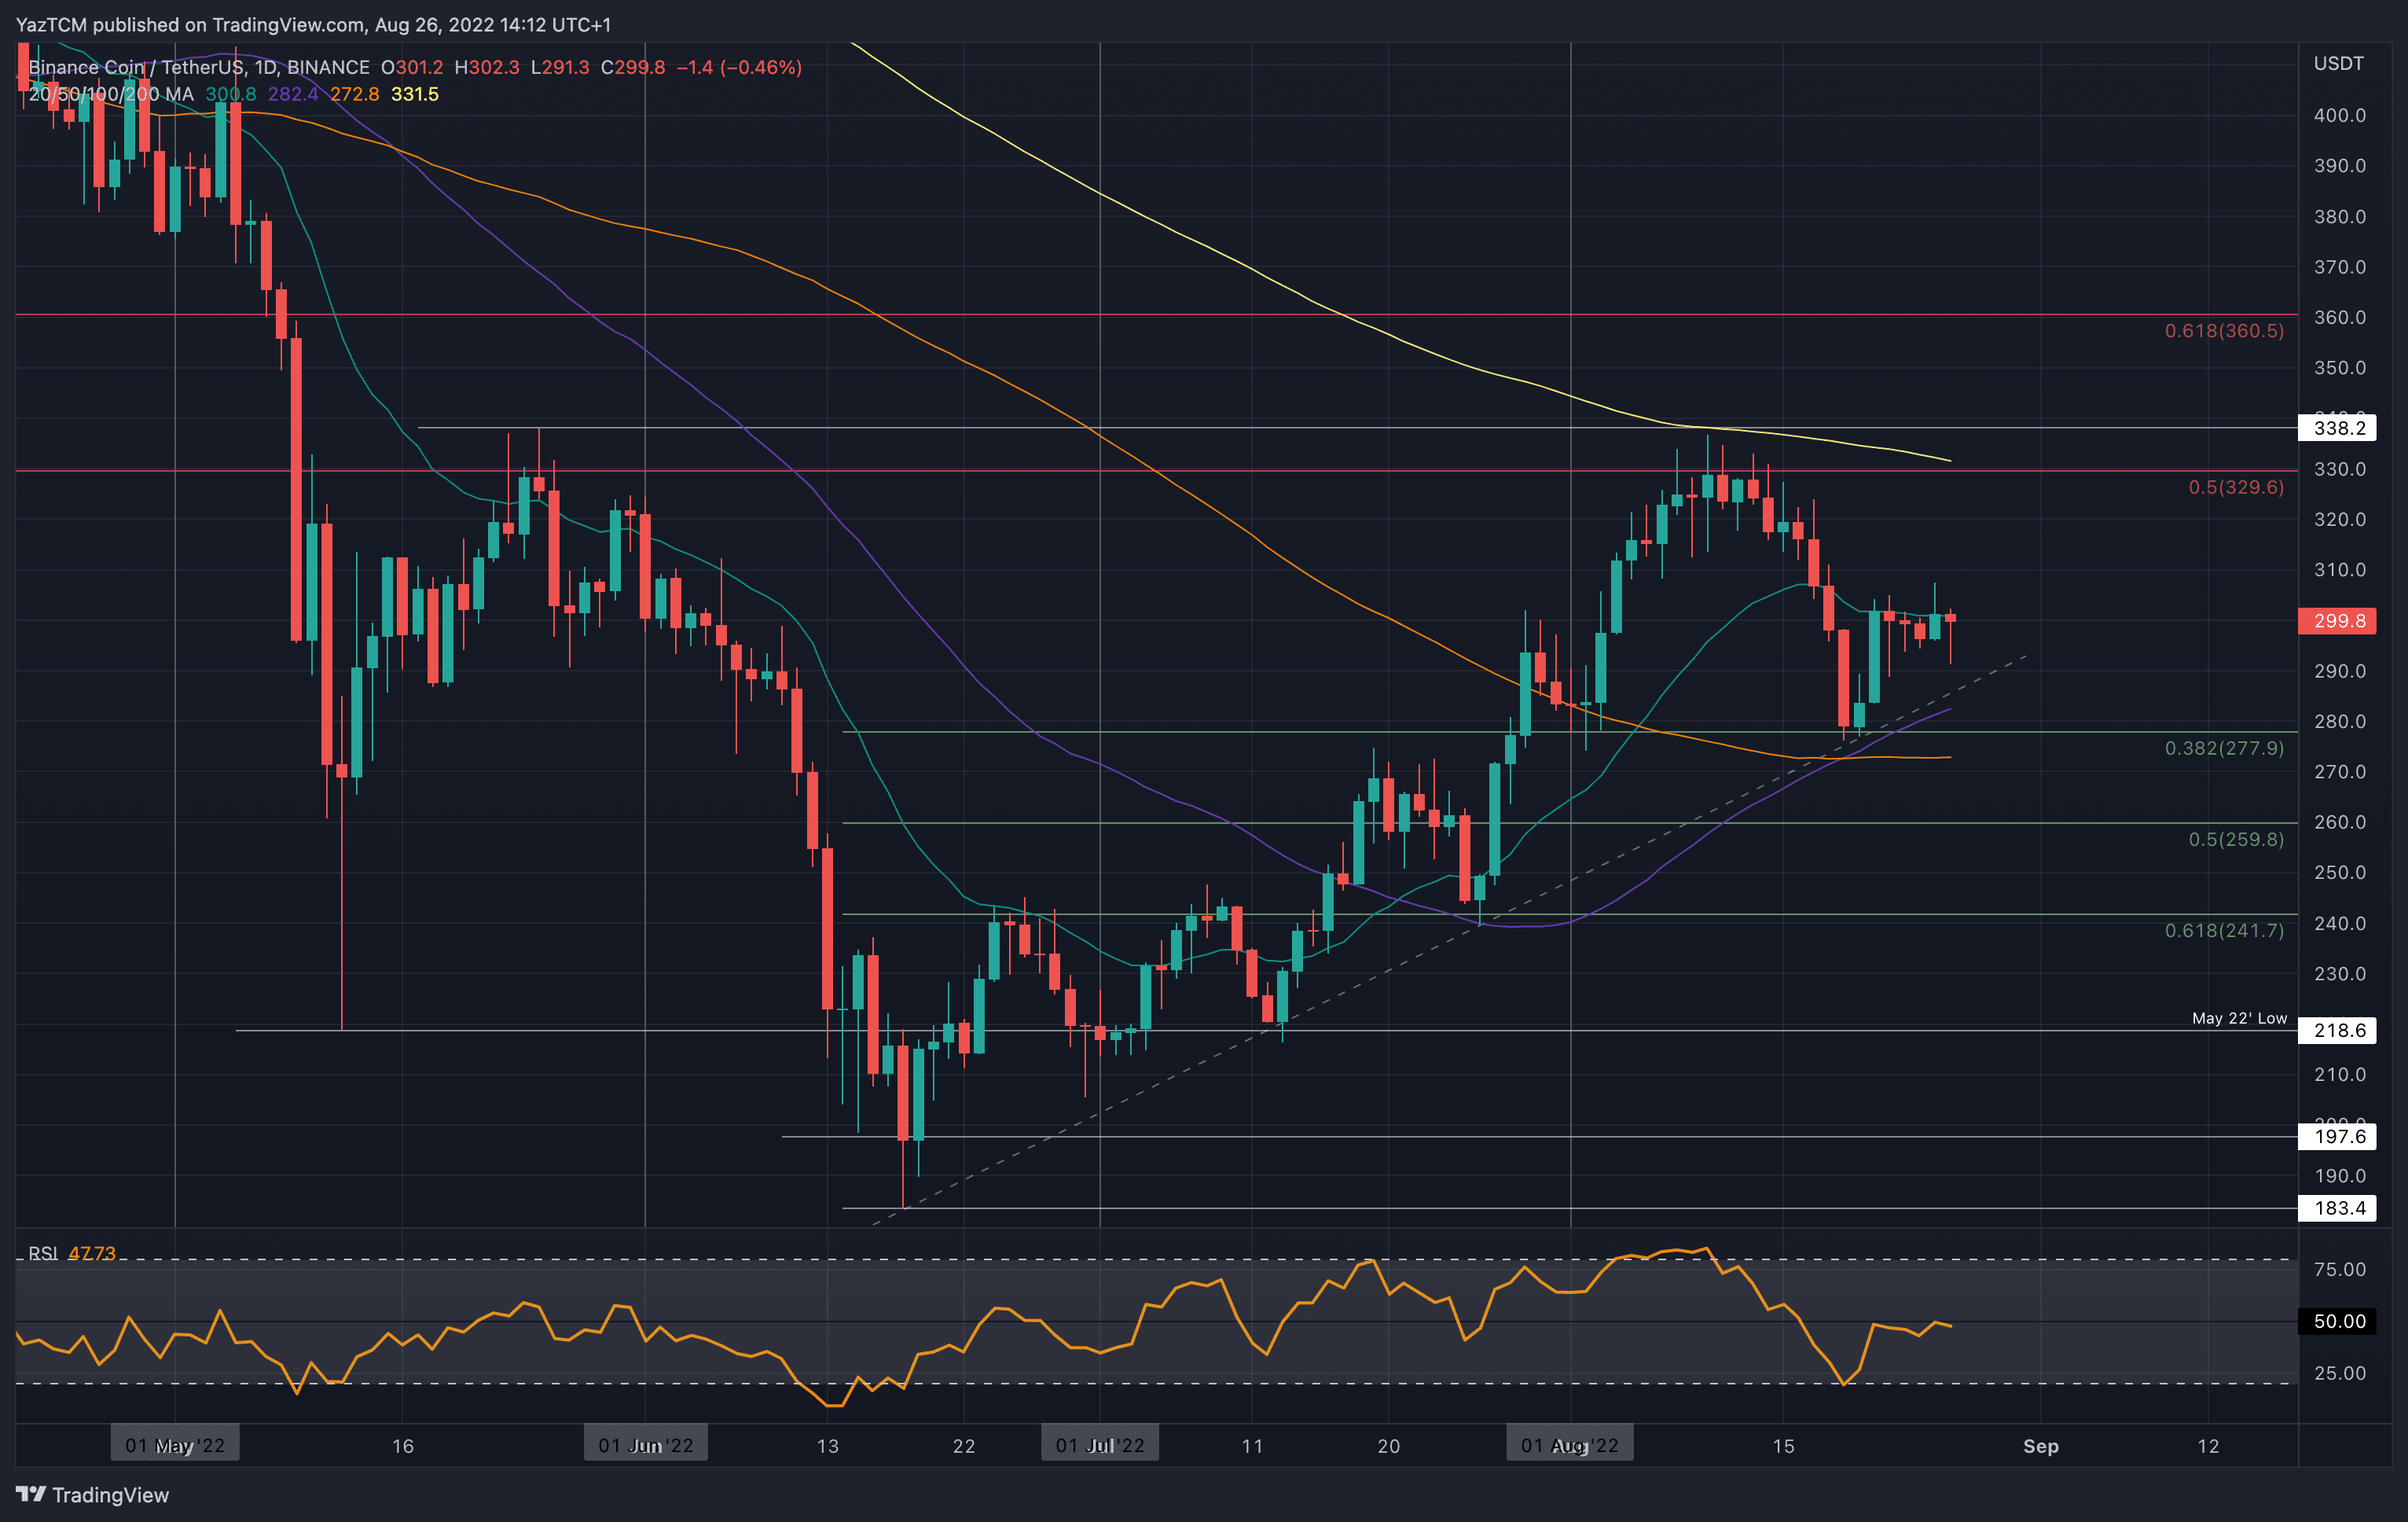
BNB is flat over the week as it trades just beneath $300. BNB surged in the first week of August to reach resistance at $330 (bearish .5 Fib). From there, it rolled over and started to head lower last week.
Last Friday, the price collapse caused BNB to fall below $300, dropping as low as $278 (.382 Fib & a rising trend line). It found support there and started to rally over the weekend but found resistance at the 20-day MA at around $300 on Monday and has still not managed to produce a daily closing candle above the level.
Looking ahead, if the bulls break $300, the first resistance lies at $330 (bearish .5 Fib & 200-day MA). This is followed by $338, $350, and $360.
On the other side, the first support lies at $290. This is followed by the rising trend line, $278 (.382 Fib) and $272 (100-day MA).
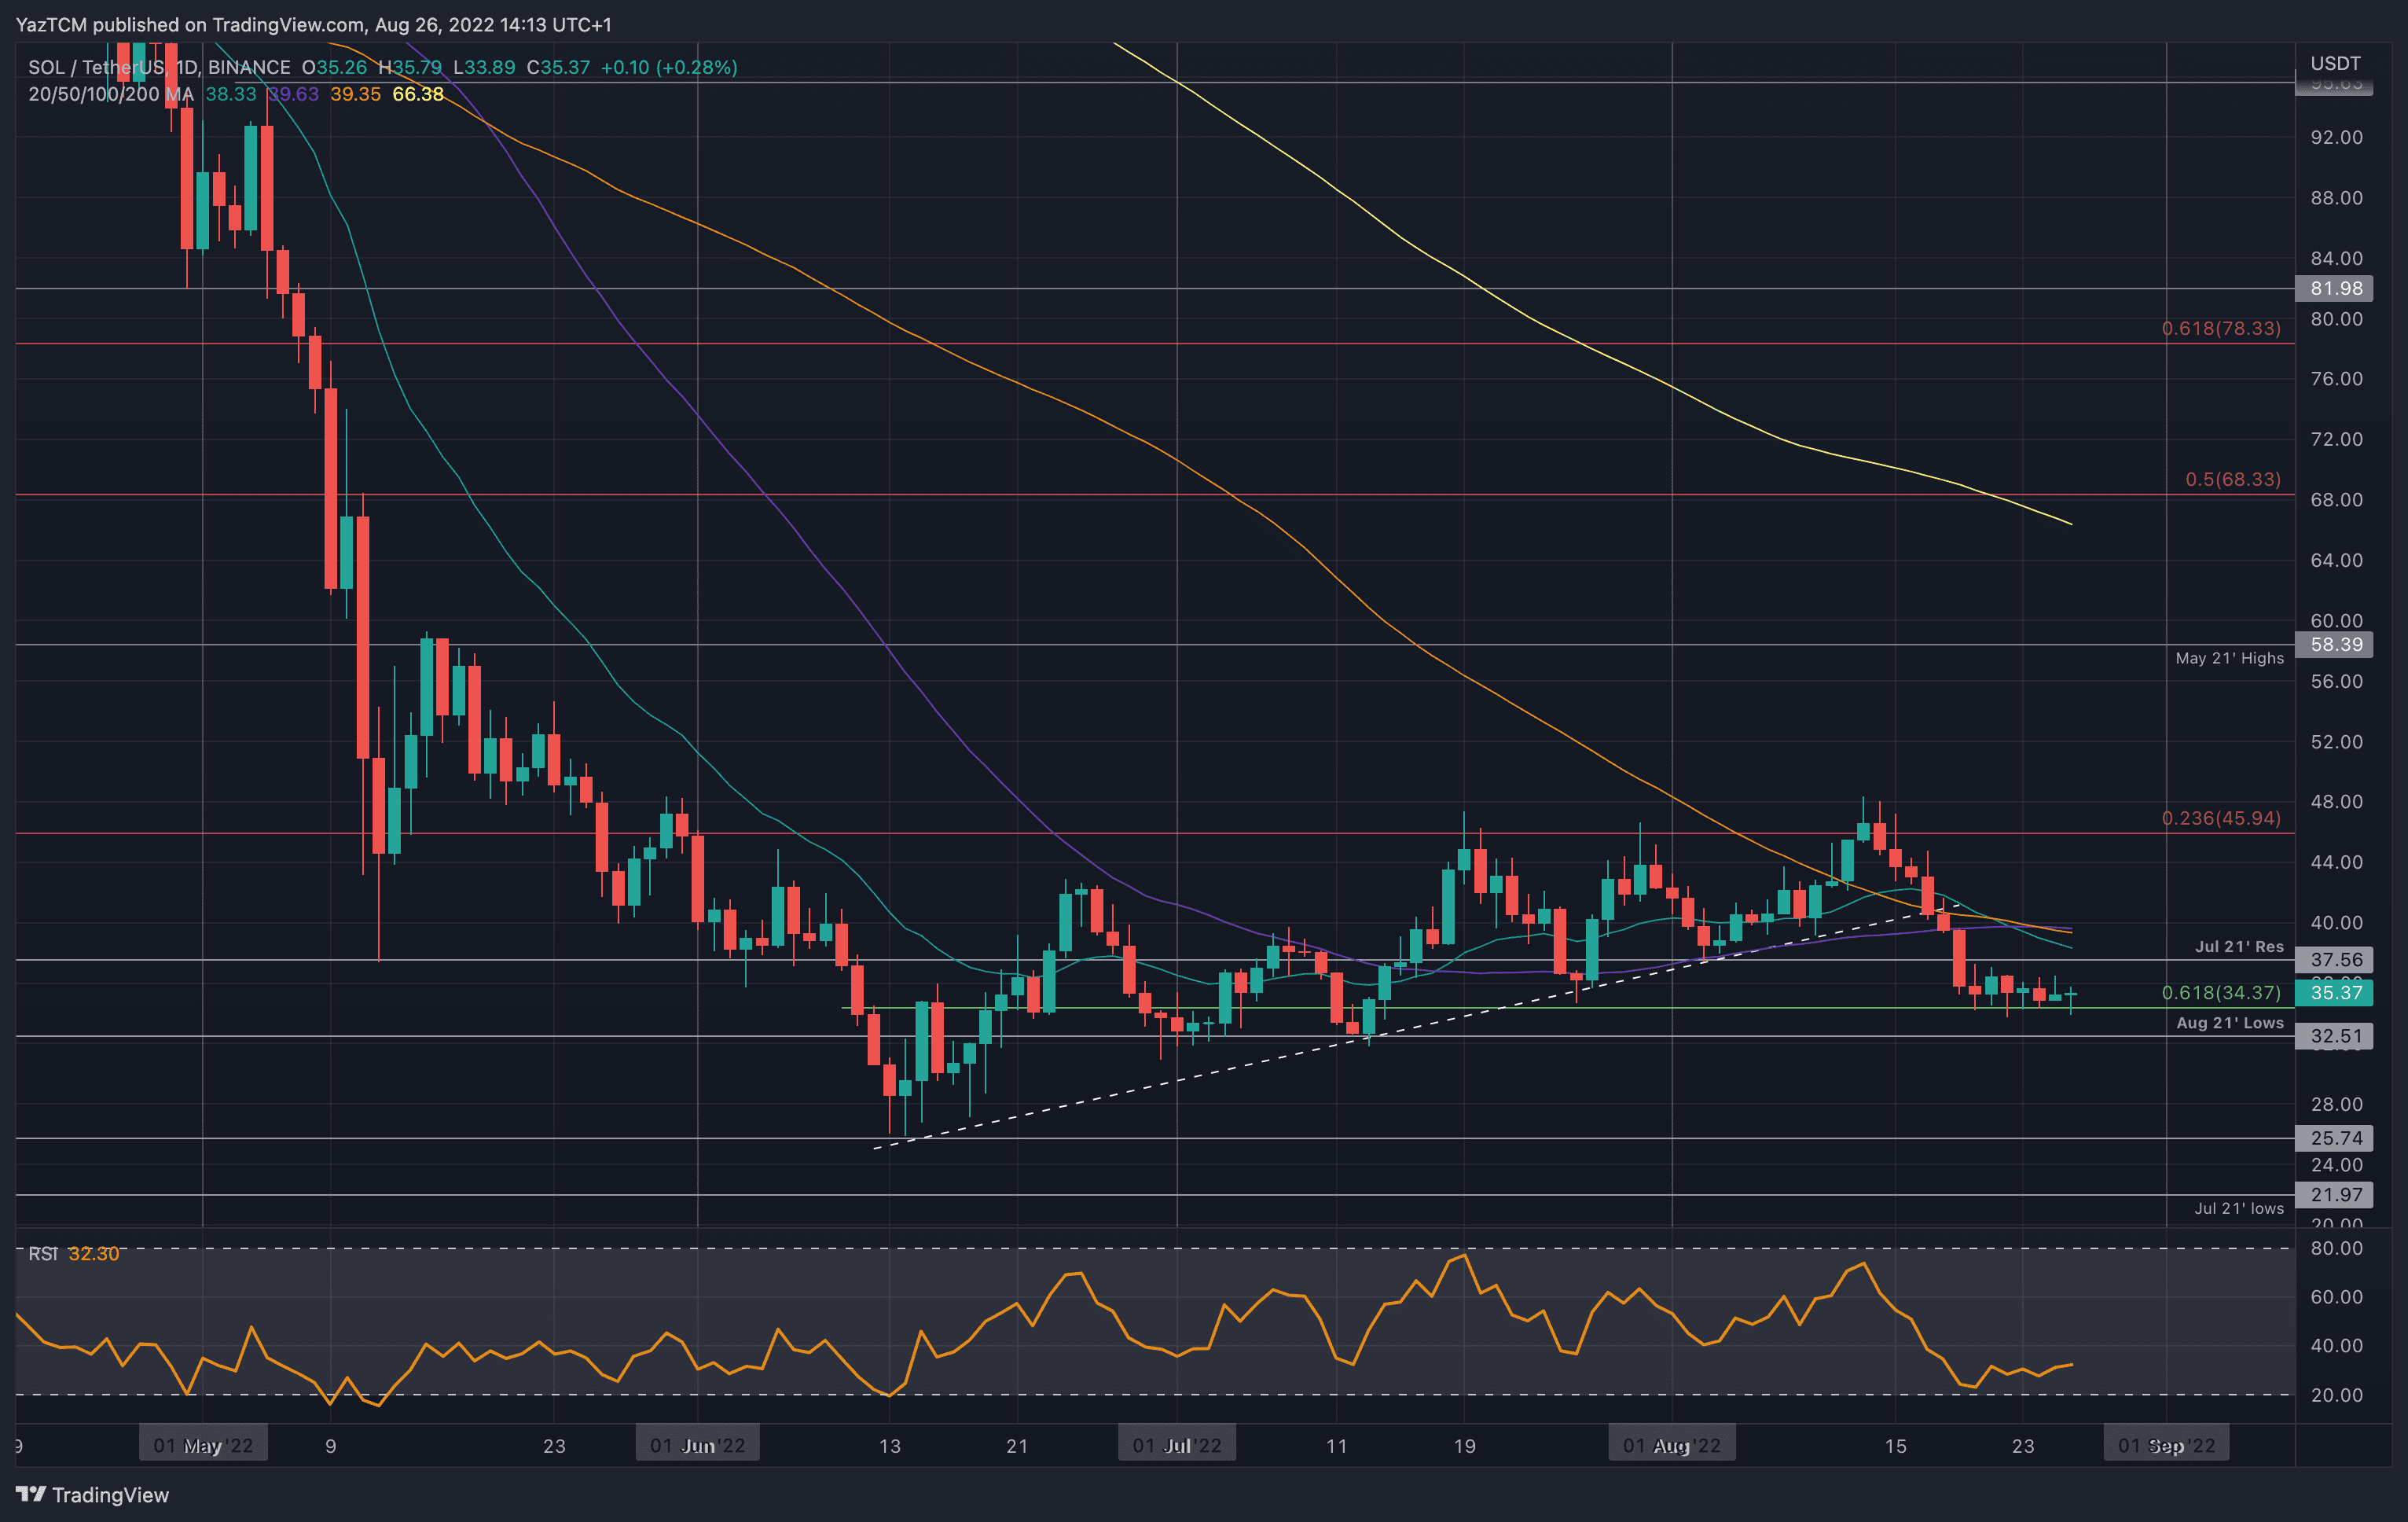
Solana
SOL is down by a strong 11% on the week and it battles to stay above support at around $35. SOL managed to set a fresh 2-month-high at the start of August, allowing it to reach as high as $48. However, it quickly rolled over from this resistance and started to fall.
Last week’s crypto price plummet caused SOL to drop beneath the 50-day MA and fall beneath $36. It continued lower until support was found at $34.35, provided by a .618 Fib Retracement. SOL held this support all week but struggled to overcome $36.
Looking ahead, if the bears push beneath $34.35, the first support lies at $32.50 (August 2021 lows). This is followed by $30, $28, and $25.75.
On the other side, the first resistance lies at $36. This is followed by $37.55 (July 2021 resistance), $40 (50/100-day MAs), $44, and $48.