Ethereum is about to close a third green weekly candle. However, it seems like the bullish move has weakened as ETH faces strong resistance (marked by red). The weekly candle closes soon, and the bulls still seem to have control over the market. The opening of global markets on Monday may have a significant impact on determining the market’s trend. Technical analysis by Grizzly The Daily Chart Ethereum has reached a zone of solid resistance on the daily timeframe, combined with the horizontal resistance at 00, the daily MA200 (marked by white), and the Fibonacci Retracement level at 0.618. This barrier caused ETH to keep on getting rejected. If the bulls can break above this resistance, the next destination will likely be in the resistance zone at $3900 – 00.
Topics:
CryptoVizArt considers the following as important: ETH Analysis, ETHBTC, Ethereum (ETH) Price, ethusd
This could be interesting, too:
Mandy Williams writes Ethereum Derivatives Metrics Signal Modest Downside Tail Risk Ahead: Nansen
Jordan Lyanchev writes Weekly Bitcoin, Ethereum ETF Recap: Light at the End of the Tunnel for BTC
CryptoVizArt writes Will Weak Momentum Drive ETH to .5K? (Ethereum Price Analysis)
Jordan Lyanchev writes Bybit Hack Fallout: Arthur Hayes, Samson Mow Push for Ethereum Rollback
Ethereum is about to close a third green weekly candle. However, it seems like the bullish move has weakened as ETH faces strong resistance (marked by red).
The weekly candle closes soon, and the bulls still seem to have control over the market. The opening of global markets on Monday may have a significant impact on determining the market’s trend.
Technical analysis by Grizzly
The Daily Chart
Ethereum has reached a zone of solid resistance on the daily timeframe, combined with the horizontal resistance at $3500, the daily MA200 (marked by white), and the Fibonacci Retracement level at 0.618. This barrier caused ETH to keep on getting rejected.
If the bulls can break above this resistance, the next destination will likely be in the resistance zone at $3900 – $4000. Otherwise, if the bears push the price down, the zone of support at $3000 – $3200 is the first major support.
RSI 30-day indicator: in the bullish zone and close to the marked descending line. If the price breaks above the key resistance, then the RSI will break above the descending line.
MA levels:
MA20: $3115
MA50: $2883
MA100: $3014
MA200: $3488
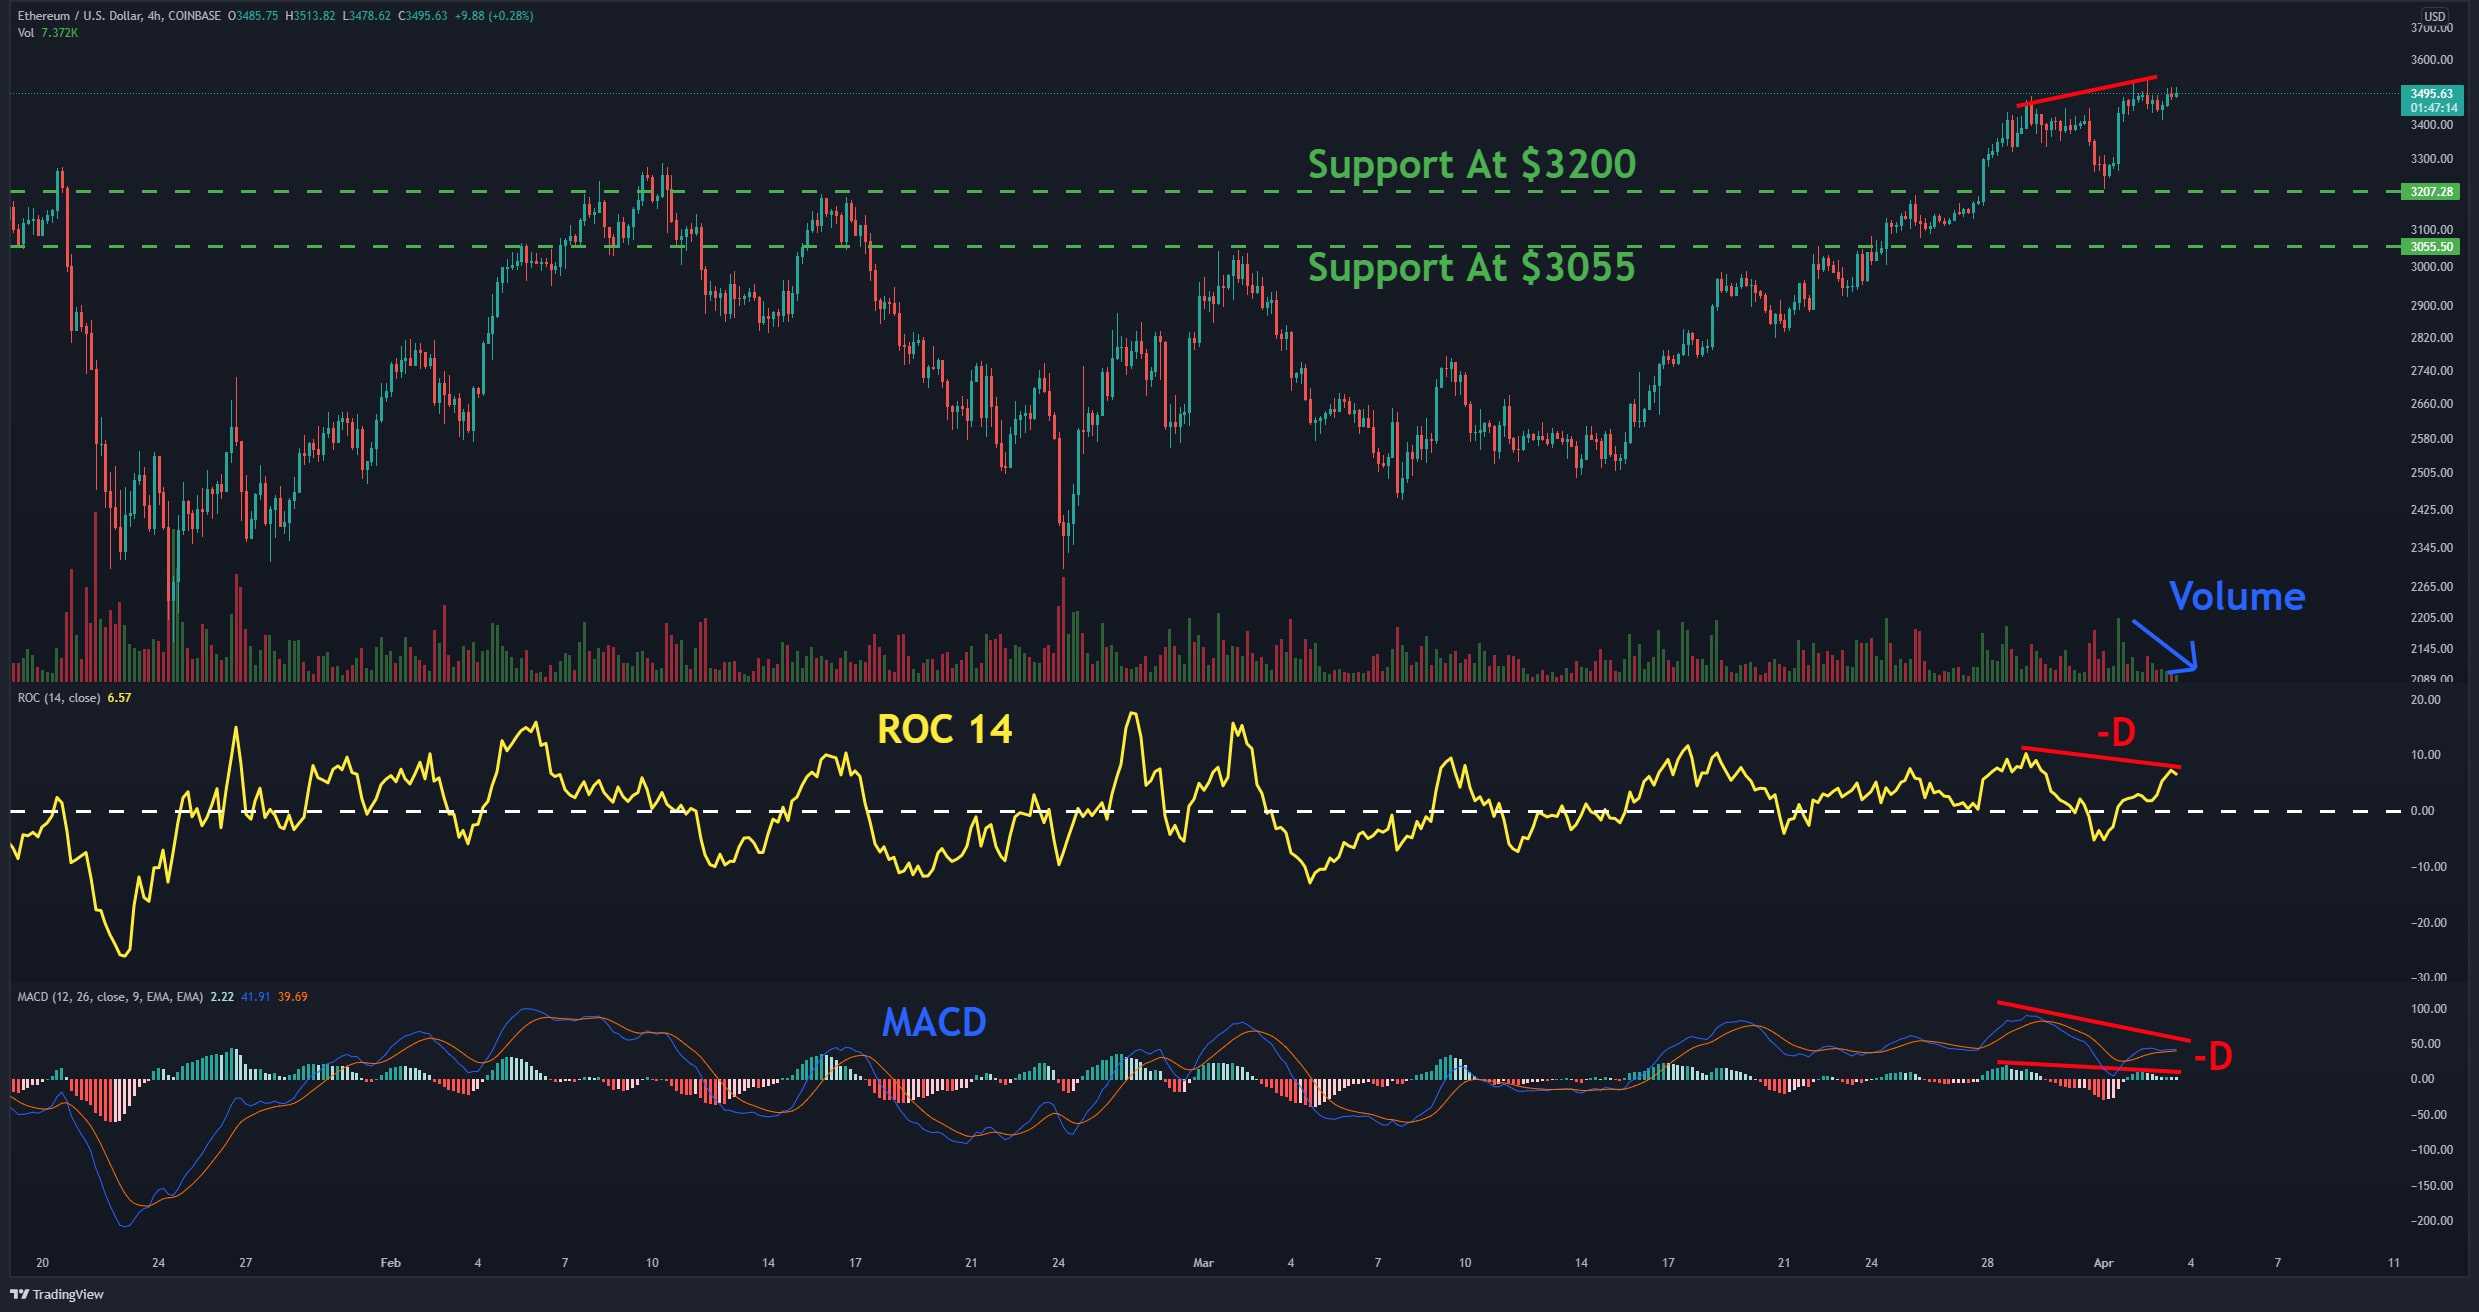
The 4-Hour Chart
On the 4-hour timeframe, as mentioned in the analysis above, ETH is struggling with the resistance at $3500, and breaking above it is critical.
In this time frame, bearish divergence (marked by red) is observed in the MACD and ROC-14 indicators and may cause short-term price correction.
It is better to be a little more cautious when the price is below a major resistance as also the trading volume is low (marked by blue) and reduces the trading risk. If ETH fails to break above this resistance, the support levels are $3200 , then $3055
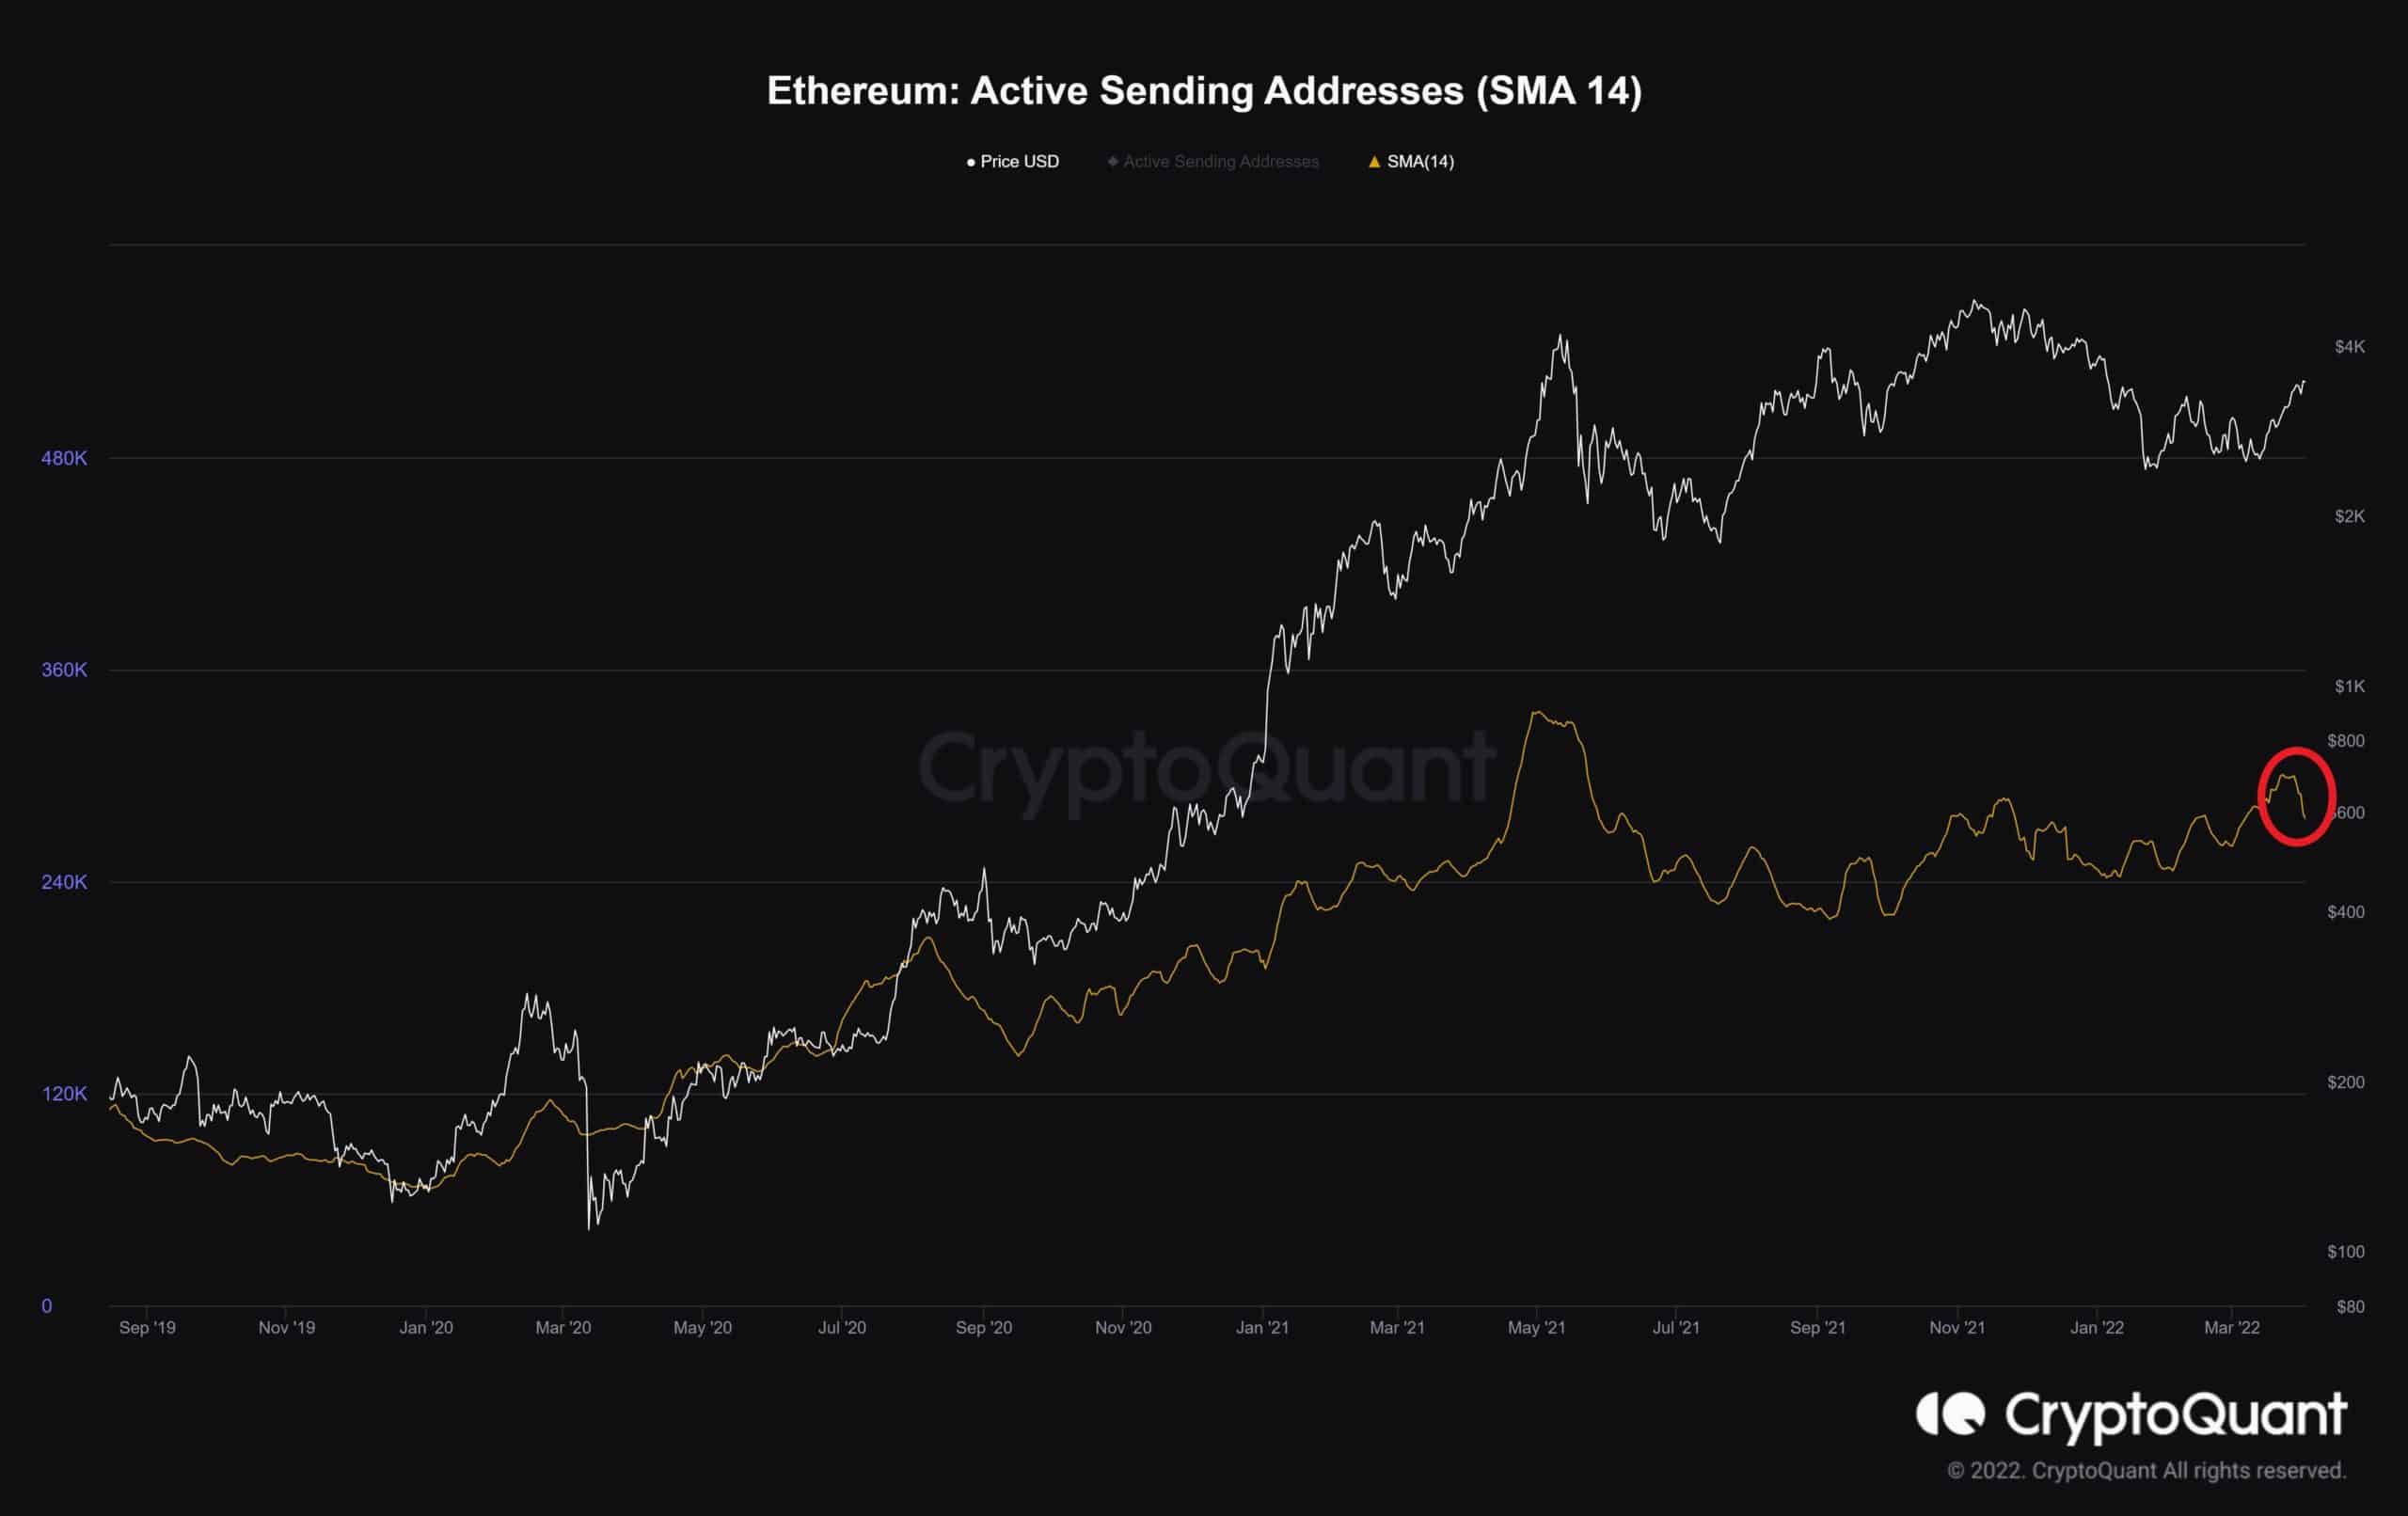
On-chain analysis: Active Sending Addresses (SMA 14)
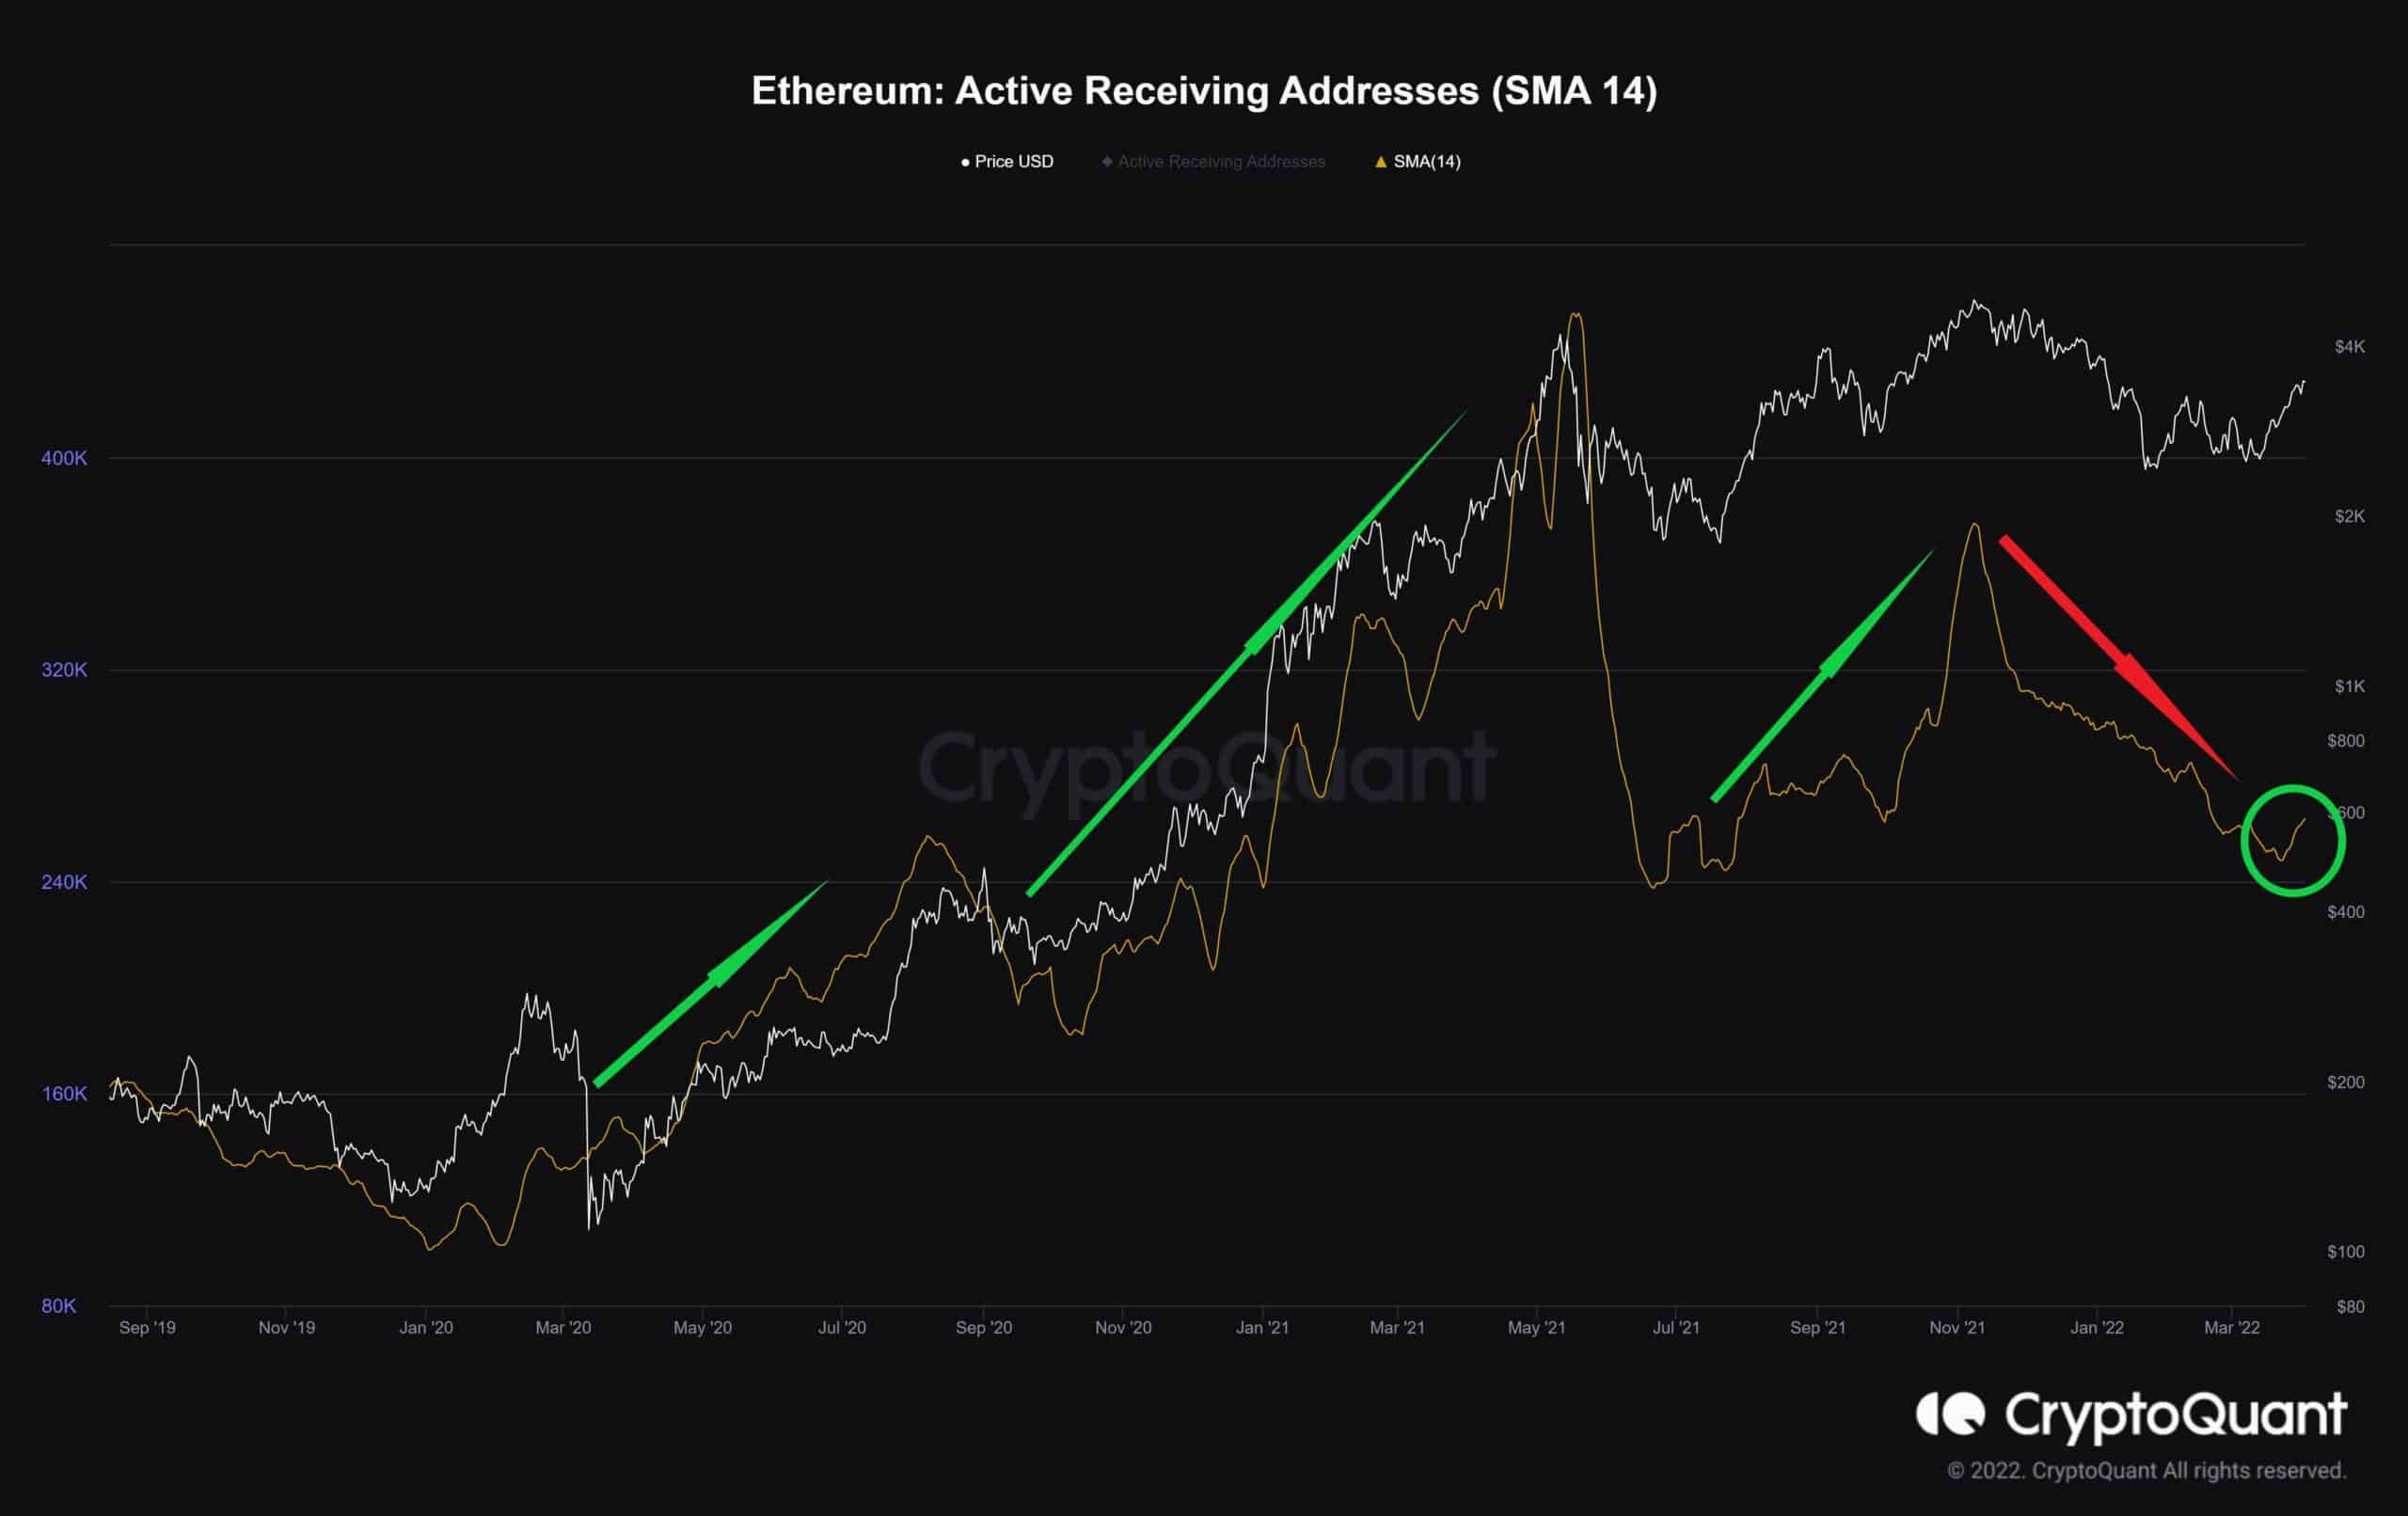
The number of addresses that were active as a receiver is increasing.
As can be seen in the chart below, the rise of this metric has led to an increase in the ETH price. However, it is not as much as it used to be, but it can be promising after decreasing from the all-time high (marked by red).
The slope of this increase is also critical and it seems like the buyers are coming back to the market when this metric has increased significantly.
On the other hand, the Active Sending Addresses is dropping, but this decline is still not significant and we have to wait and see if Ethereum breaks its zone of resistance to convince buyers that the bear market is over.