Ethereum price is struggling below the ,700 resistance against the US Dollar. ETH price is now trading below ,700 and the 55 simple moving average (4 hours). There is a key bearish trend line forming with resistance near ,660 on the 4-hour chart (data feed from Coinbase). The pair could continue to move down if it stays below ,660 and ,700. Ethereum price is declining below ,700 against the US Dollar. ETH/USD remains at a risk of more downsides if it breaks the ,620 support zone. Ethereum Price Analysis After a strong decline, Ethereum found support near the ,540 zone against the US Dollar. ETH price formed a base and started a recovery wave above the ,580 level. There was a decent recovery wave above the ,600 level. The price climbed above
Topics:
Aayush Jindal considers the following as important: Altcoin News, ETH, News, Trading
This could be interesting, too:
Bitcoin Schweiz News writes Meme Coins frühzeitig entdecken: So gelingt der Einstieg vor dem Hype
Bitcoin Schweiz News writes Bitpanda vs. Binance: Welche Bitcoin-App ist die beste für die Schweiz?
Bilal Hassan writes Morocco Cracks Down on Crypto Property Deals
Bilal Hassan writes Crypto Becomes a U.S. ‘Weapon,’ Says CryptoQuant CEO
- Ethereum price is struggling below the $1,700 resistance against the US Dollar.
- ETH price is now trading below $1,700 and the 55 simple moving average (4 hours).
- There is a key bearish trend line forming with resistance near $1,660 on the 4-hour chart (data feed from Coinbase).
- The pair could continue to move down if it stays below $1,660 and $1,700.
Ethereum price is declining below $1,700 against the US Dollar. ETH/USD remains at a risk of more downsides if it breaks the $1,620 support zone.
Ethereum Price Analysis
After a strong decline, Ethereum found support near the $1,540 zone against the US Dollar. ETH price formed a base and started a recovery wave above the $1,580 level.
There was a decent recovery wave above the $1,600 level. The price climbed above the 23.6% Fib retracement level of the downward move from the $1,860 swing high to the $1,540 low. However, it is facing resistance below the $1,700 level.
Ether is now trading below $1,700 and the 55 simple moving average (4 hours). On the upside, the price is now facing resistance near the $1,660 level.
There is also a key bearish trend line forming with resistance near $1,660 on the 4-hour chart. The next major resistance is near the $1,700 level. The 50% Fib retracement level of the downward move from the $1,860 swing high to the $1,540 low is also near $1,700.
A clear move above the $1,700 resistance could send the price toward $1,785. Any more gains could even send the price toward the $1,820 resistance zone or even $1,850 in the near term.
On the downside, initial support is near the $1,620 level. The next major support is now near the $1,600 level. A break below the $1,600 support could push the price to $1,540. If the bulls fail to protect the $1,540 support, the price might decline toward $1,450.
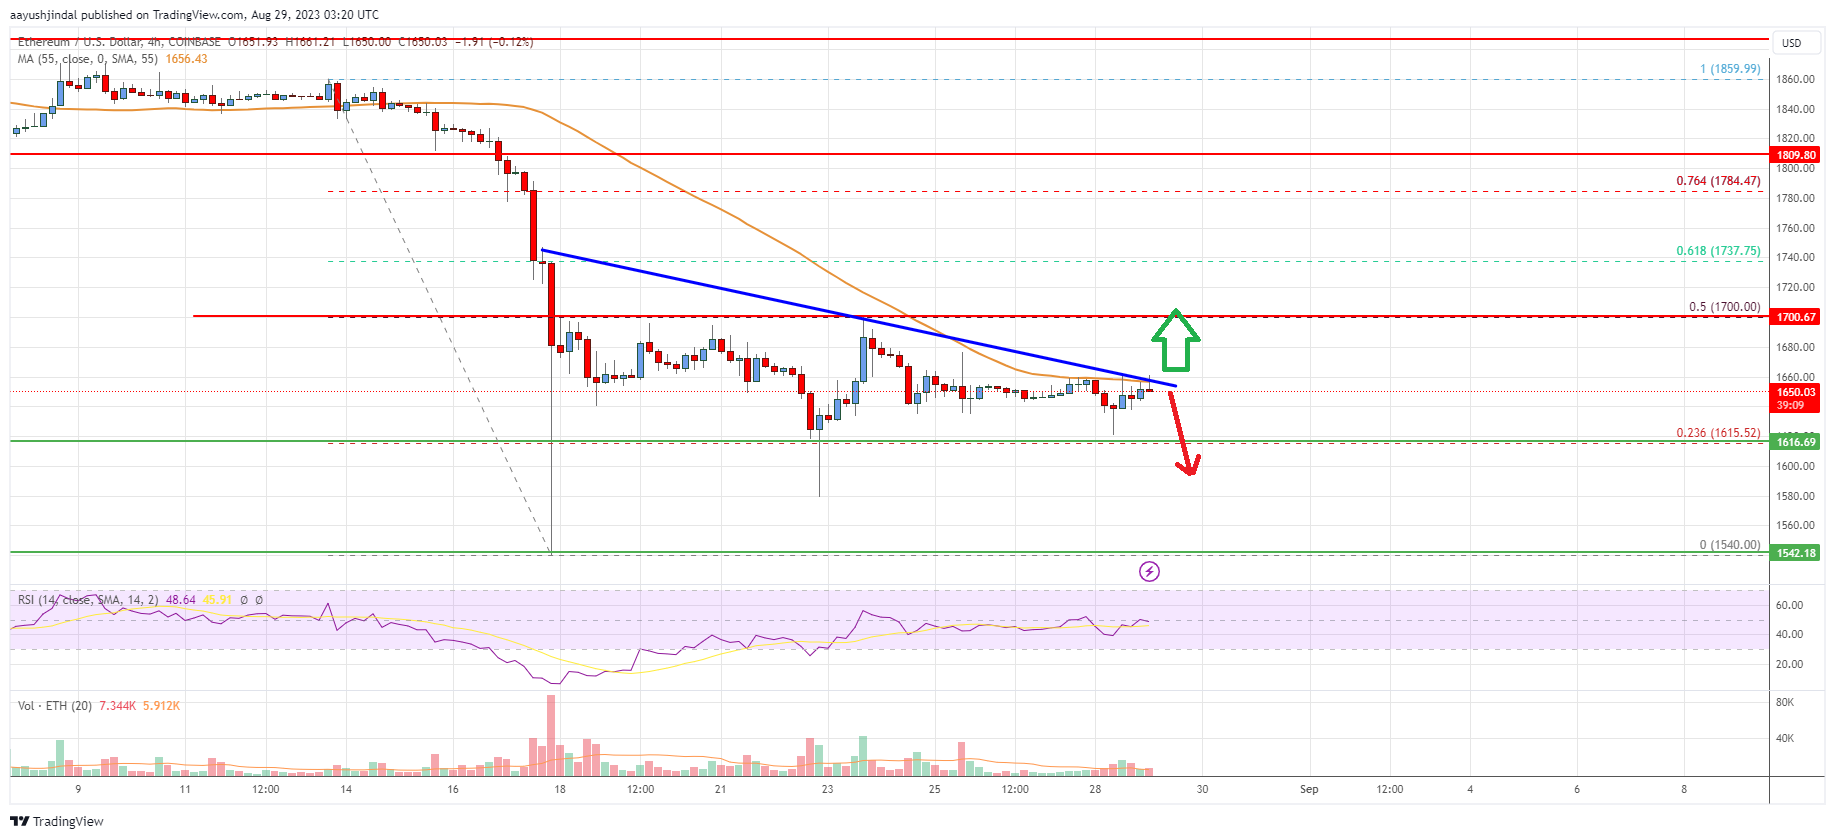
Looking at the chart, Ethereum price is trading below $1,700 and the 55 simple moving average (4 hours). Overall, Ether’s price could continue to move down if it stays below $1,660 and $1,700.
Technical indicators
4 hours MACD – The MACD for ETH/USD is now losing momentum in the bearish zone.
4 hours RSI (Relative Strength Index) – The RSI for ETH/USD is now below the 50 level.
Key Support Levels – $1,620, followed by the $1,600 zone.
Key Resistance$ Levels – $1,660 and $1,700.