Ethereum’s price has been on a gradual decline since mid-March and has yet to show any decisive sign of recovery. Yet today’s price action is critical, as it can finally bring back some bullish momentum to the market. Technical Analysis By TradingRage The Daily Chart Looking at the daily timeframe, Ethereum’s price has been trending lower inside a large descending channel and is yet to break it to either side. Meanwhile, the cryptocurrency is currently testing the midline of the range and the key ,000 level. With the 200-day moving average located near the ,800 support zone, the market seems more likely to rally higher toward the ,600 resistance zone in the coming weeks. Source: TradingViewThe 4-Hour Chart The 4-hour chart paints a more clear picture. Ethereum’s
Topics:
CryptoVizArt considers the following as important: ETH Analysis, ETHBTC, Ethereum (ETH) Price, ethusd
This could be interesting, too:
Mandy Williams writes Ethereum Derivatives Metrics Signal Modest Downside Tail Risk Ahead: Nansen
Jordan Lyanchev writes Weekly Bitcoin, Ethereum ETF Recap: Light at the End of the Tunnel for BTC
CryptoVizArt writes Will Weak Momentum Drive ETH to .5K? (Ethereum Price Analysis)
Jordan Lyanchev writes Bybit Hack Fallout: Arthur Hayes, Samson Mow Push for Ethereum Rollback
Ethereum’s price has been on a gradual decline since mid-March and has yet to show any decisive sign of recovery.
Yet today’s price action is critical, as it can finally bring back some bullish momentum to the market.
Technical Analysis
By TradingRage
The Daily Chart
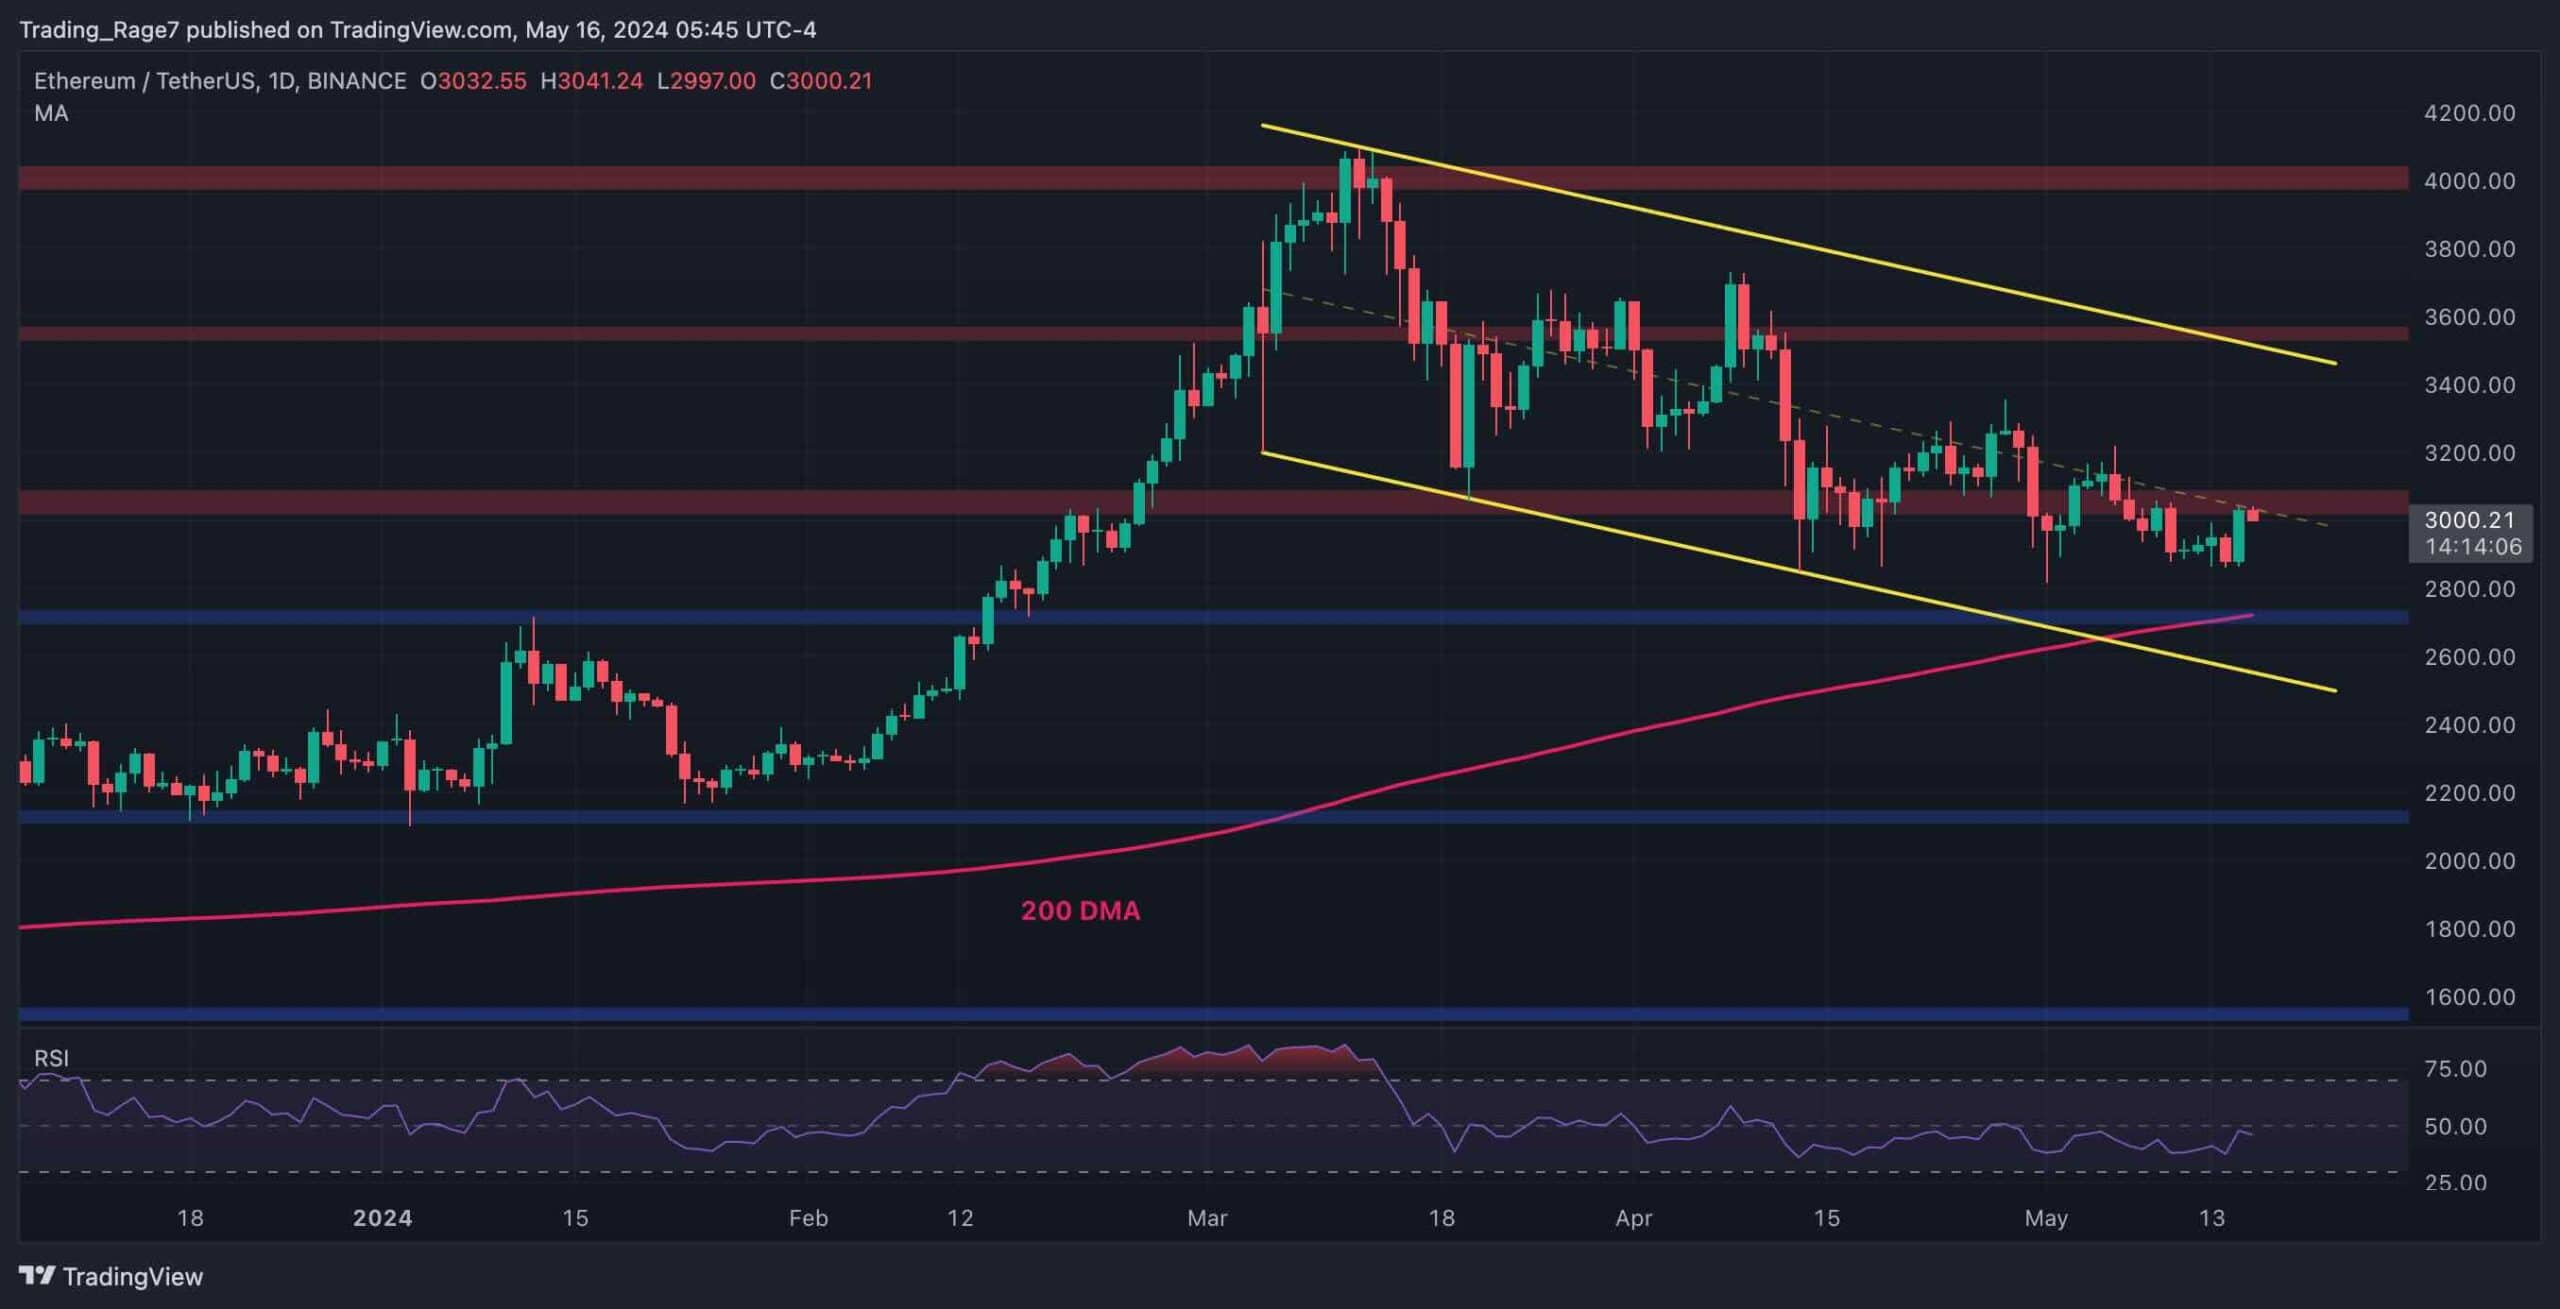
Looking at the daily timeframe, Ethereum’s price has been trending lower inside a large descending channel and is yet to break it to either side.
Meanwhile, the cryptocurrency is currently testing the midline of the range and the key $3,000 level. With the 200-day moving average located near the $2,800 support zone, the market seems more likely to rally higher toward the $3,600 resistance zone in the coming weeks.
The 4-Hour Chart
The 4-hour chart paints a more clear picture. Ethereum’s price has been rapidly rising since yesterday, but it is currently being held by the midline of the channel and the $3,000 resistance level.
Meanwhile, the RSI is showing values above 50% at the moment, indicating that the momentum is in favor of the buyers. Therefore, a breakout above the midline of the channel could lead to a quick rally toward the $3,600 resistance area.

Sentiment Analysis
By TradingRage
Exchange Reserve
Ethereum’s price has been following a downward trajectory since its rejection from the $4,000 level. Meanwhile, analyzing the market’s supply and demand dynamics can yield important information.
This chart presents the Exchange Reserve metric and its 30-day moving overage for Ethereum. Rising values are typically associated with an increase in selling pressure, as they usually indicate that the deposits are being exchanged by holders who want to sell their coins.
As the chart demonstrates, the exchange reserve metric has been experiencing an overall decline during the last few months. However, the metric has recently broken above its moving average, a sign that unusual selling has previously materialized during price drops or reversals. Therefore, investors should be hopeful that the supply will be met with sufficient demand, or things could get ugly soon.
