Ethereum price started a downside correction from the ,720 resistance against the US Dollar. ETH price is now trading above ,450 and the 55 simple moving average (4 hours). There is a key declining channel forming with support at ,420 on the 4-hour chart (data feed from Coinbase). The pair could start a fresh increase if it clears the ,560 resistance zone. Ethereum price is declining below ,600 against the US Dollar. ETH/USD remains at a risk of more downsides below the ,420 support zone. Ethereum Price Analysis In the past few weeks, Ethereum started a decent increase above the ,320 resistance zone against the US Dollar. ETH price climbed above the ,400 and ,500 resistance levels. Finally, it tested the ,720 resistance zone. A high was
Topics:
Aayush Jindal considers the following as important: Altcoin News, ETH, News, Trading
This could be interesting, too:
Bitcoin Schweiz News writes Meme Coins frühzeitig entdecken: So gelingt der Einstieg vor dem Hype
Bitcoin Schweiz News writes Bitpanda vs. Binance: Welche Bitcoin-App ist die beste für die Schweiz?
Bilal Hassan writes Morocco Cracks Down on Crypto Property Deals
Bilal Hassan writes Crypto Becomes a U.S. ‘Weapon,’ Says CryptoQuant CEO
- Ethereum price started a downside correction from the $2,720 resistance against the US Dollar.
- ETH price is now trading above $2,450 and the 55 simple moving average (4 hours).
- There is a key declining channel forming with support at $2,420 on the 4-hour chart (data feed from Coinbase).
- The pair could start a fresh increase if it clears the $2,560 resistance zone.
Ethereum price is declining below $2,600 against the US Dollar. ETH/USD remains at a risk of more downsides below the $2,420 support zone.
Ethereum Price Analysis
In the past few weeks, Ethereum started a decent increase above the $2,320 resistance zone against the US Dollar. ETH price climbed above the $2,400 and $2,500 resistance levels.
Finally, it tested the $2,720 resistance zone. A high was formed near $2,717 before there was a downside correction. There was a move below the $2,600 support zone. The price even traded below the 23.6% Fib retracement level of the upward move from the $2,167 swing low to the $2,717 high.
ETH is now trading above $2,450 and the 55 simple moving average (4 hours). There is also a key declining channel forming with support at $2,420 on the 4-hour chart.
On the upside, the price is now facing resistance near the $2,550 level. The next major resistance is near the $2,580 level. The next major resistance is near the $2,600 zone. A clear move above the $2,580 and $2,600 resistance levels might call for a fresh move to $2,720.
Any more gains could even send the price toward the $2,850 resistance zone or even $2,920 in the near term. On the downside, initial support is near the $2,440 level and the 50% Fib retracement level of the upward move from the $2,167 swing low to the $2,717 high.
The next major support is now near the $2,400 level. A break below the $2,400 support could push the price to $2,280. If the bulls fail to protect the $2,280 support, the price might decline toward $2,165.
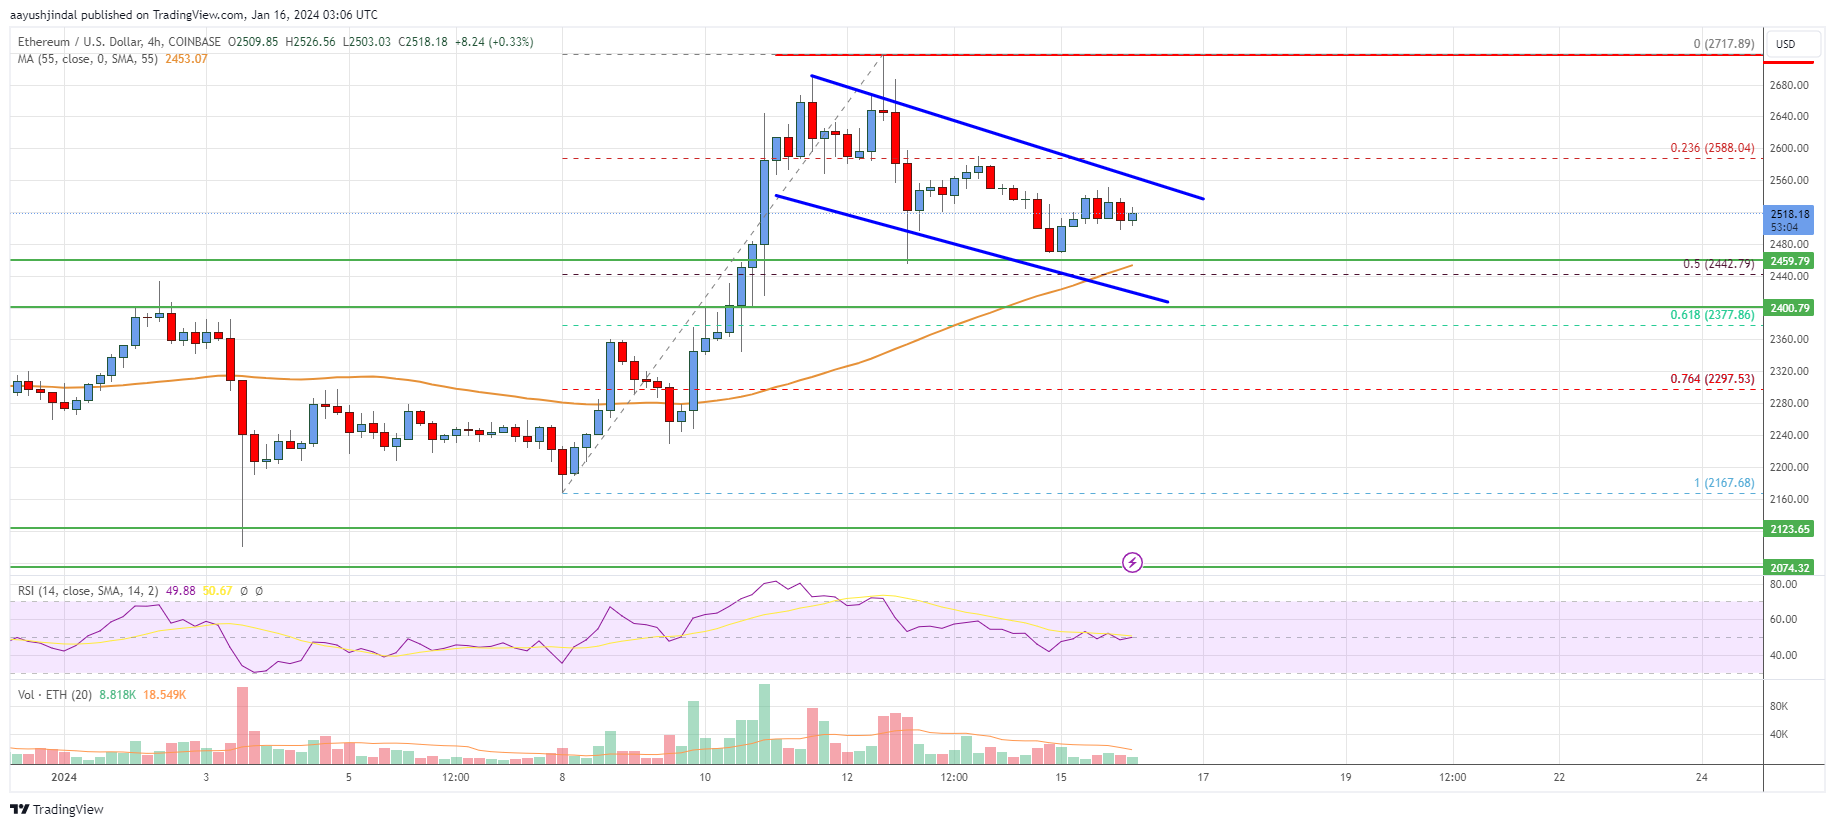
Looking at the chart, Ethereum price is clearly trading above $2,400 and the 55 simple moving average (4 hours). Overall, Ether price could continue to move down if it breaks the $2,420 support zone.
Technical indicators
4 hours MACD – The MACD for ETH/USD is now losing momentum in the bullish zone.
4 hours RSI (Relative Strength Index) – The RSI for ETH/USD is now below the 50 level.
Key Support Levels – $2,440, followed by the $2,420 zone.
Key Resistance Levels – $2,560 and $2,600.