CryptoVizArt
February 8, 2024
Crypto news, Markets, Ripple (XRP)
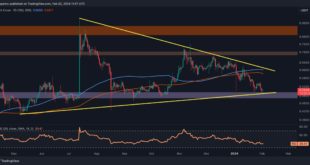
Ripple has been enduring a consistent downtrend characterized by low volatility and a lack of momentum in its price movement.
However, it has recently found itself at a pivotal support region near the $0.50 mark, potentially poised for a phase of sideways consolidation before its next significant move.
By Shayan
The Daily Chart
Upon a close examination of the daily chart, Ripple’s price trajectory reveals a gradual decline, resulting in its arrival at a crucial support...
Read More »
Duo Nine
February 2, 2024
Crypto news, Ethereum (ETH), Markets, Ripple (XRP)
This week, we take a closer look at Ethereum, Ripple, Cardano, Solana, and Binance Coin.
Ethereum (ETH)
Ethereum appears to have found good support at $2,200 and has since returned on an uptrend, closing the week with a 3.6% price increase.
The price action looks promising, and buyers are returning to the market. This optimism is also reflected in the daily MACD, which is making higher lows on the histogram.
Looking ahead, ETH is working its way back up and could soon...
Read More »
CryptoVizArt
February 2, 2024
Crypto news, Ripple (XRP)
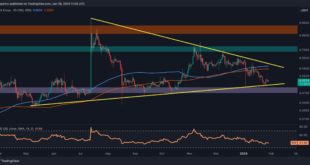
Ripple’s recent downtrend has persisted, resulting in the price falling below both the 100 and 200-day moving averages.
Despite this decline, XRP has reached a substantial support region, marked by the triangle’s lower boundary at $0.5, and a short-term reversal is anticipated.
By Shayan
The Daily Chart
A thorough examination of the daily chart reveals a pronounced decline in Ripple’s price, ultimately leading to its arrival at a critical and decisive support region. This...
Read More »
CryptoVizArt
January 29, 2024
Crypto news, Ripple (XRP)
Ripple’s price has been confined within a symmetrical triangle pattern since the latter half of 2023. However, a recent sharp decline has brought the price to the lower boundary of the triangle, where it may find support in the coming days. The subsequent breakout from this triangle pattern will play a pivotal role in shaping Ripple’s future prospects.
By Shayan
The Daily Chart
A comprehensive analysis of the daily chart shows a noticeable downturn in Ripple’s price,...
Read More »
CryptoVizArt
January 25, 2024
Bitcoin (BTC), Crypto news, Markets, Ripple (XRP), Tether (USDT)
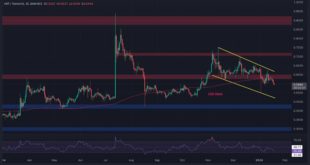
Ripple’s price is continuing its downward momentum on both the USDT and BTC pairs. According to technical analysis, the price is yet to reach a potential turning point on either chart.
Technical Analysis
By TradingRage
Ripple Price Analysis: The USDT Paired Chart
Against USDT, the price has been trapped inside a descending channel over the last few months. Since the breakdown of the 200-day moving average (currently located around the $0.60 mark), the market has been dropping...
Read More »
CryptoVizArt
January 19, 2024
Bitcoin (BTC), Crypto news, Markets, Ripple (XRP), Tether (USDT)
Ripple’s price action against both USDT and BTC has been bearish for the last few months. Analyzing the charts might provide clues on the potential direction of the market in the short term.
Technical Analysis
By TradingRage
Ripple Price Analysis: The USDT Paired Chart
Against USDT, XRP has been on the decline since getting rejected from the resistance $0.7 level. The price has been trapped inside a descending channel, failing to break it to the upside on multiple occasions....
Read More »
CryptoVizArt
January 10, 2024
Crypto news, Ripple (XRP)
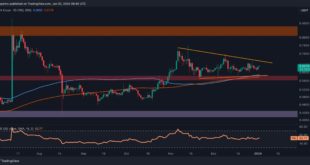
Ripple has recently faced heightened selling pressure, propelling the price below a crucial support region that includes the wedge’s lower boundary and the 100-day and 200-day moving averages.
However, a completed pullback has recently emerged, confirming the validity of the breakout.
By Shayan
The Daily Chart
The daily chart reveals a pronounced drop in Ripple’s price, breaching its multi-month sideways consolidation range. This occurrence initiated a substantial number of...
Read More »
CryptoVizArt
January 7, 2024
Crypto news, Markets, Mining, Ripple (XRP)
Following an extended period of sideways consolidation, the price underwent an unforeseen impulsive cascade, breaching the lower boundary of the range.
Consequently, the market appears to have transitioned into a phase of successive bearish movements, signaling prevailing negative sentiment.
By Shayan
Ripple Price Analysis: The Daily Chart
Examining the daily chart reveals that Ripple has decisively broken below its multi-month sideways consolidation range, experiencing a...
Read More »
CryptoVizArt
January 2, 2024
Ripple (XRP)
Ripple’s price has been navigating an extended sideways consolidation phase, displaying slight volatility. As the price approaches the narrow confines of the symmetrical triangle pattern, the potential for a significant move in either direction becomes increasingly likely.
By Shayan
Ripple Price Analysis: The Daily Chart
A closer look at the daily chart reveals a robust support region comprising the 100-day and 200-day moving averages, along with the lower boundary of the...
Read More »
CryptoVizArt
December 29, 2023
Bitcoin (BTC), Crypto news, Ripple (XRP), Tether (USDT)
Ripple’s price has been consolidating against USDT during the past few weeks while remaining clearly bearish against BTC. Analyzing both pairs might provide clues on the future price trend.
Technical Analysis
By TradingRage
Ripple Price Analysis: The USDT Chart
Against USDT, the price has been trapped inside a triangle pattern since November and is yet to break out. While the $0.6 support level has been providing support and preventing a more profound decline, the price has...
Read More »