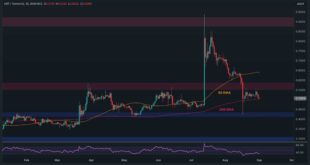
Ripple’s price has been showing a slight uptrend, retracing toward the 200-day moving average on the daily chart. However, if the cryptocurrency successfully breaks above the 200-day moving average and the significant resistance zone at $0.55, the market will probably shift into a bullish trend. XRP Analysis By Shayan The Daily Chart Upon analyzing the daily chart, Ripple’s price experienced a notable rejection, leading to a phase of consolidation. It retraced slightly toward...
Read More »Ripple Surprises with Massive Move: Here’s the Most Important Target (XRP Price Analysis)
Ripple’s price soared by almost 10% today before retracing to where it’s currently trading at. Now, let’s have a look at what this implies and where it might be headed next. Technical Analysis By Edris Ripple’s price has recently risen, leaving investors wondering if a new bullish trend is on the horizon. However, there is still an important resistance level to overcome. The USDT Paired Chart On the USDT paired chart, the price is breaking above both the 50-day and 200-day...
Read More »Crypto Price Analysis Sep-22: ETH, XRP, ADA, SOL, and BNB
This week, we take a closer look at Ethereum, Ripple, Cardano, Solana, and Binance Coin. Ethereum (ETH) Since June, Ethereum has formed a large ascending triangle. However, yesterday, the price fell under this formation and closed the week with a 2% loss. This puts ETH in a difficult position as it signals this correction may just be starting. There is good support at $1,440 and ETH may test this level before any sustained recover can be had. So far, the price action remains...
Read More »Here Are the Most Probable Scenarios for XRP in the Coming Days (Ripple Price Analysis)
Ripple’s price has been gradually declining, forming lower highs and lows against both USDT and BTC. Despite this, investors can still be optimistic, as a potential rebound from the nearby support level is possible. Technical Analysis By Edris The USDT Paired Chart The price has been going through a bearish trend on the daily timeframe against USDT. The 200-day moving average, located around the $0.5 mark, is currently acting as resistance, preventing the price from rising...
Read More »Here Are the Most Probable Scenarios for XRP in the Coming Days (Ripple Price Analysis)
Ripple’s price has been relatively stagnant over the past week, showing little intent to move in either direction. However, analyzing nearby support and resistance levels and evaluating probable scenarios would be beneficial. Technical Analysis By Edris XRP/USDT Price Analysis Against USDT, the price has been consolidating below the 200-day moving average, located around the $0.5 mark. It has failed to close above the mentioned moving average in the last few days. The RSI...
Read More »Why is XRP Declining and When Will the Bulls Get Back? (Ripple Price Analysis)
Ripple’s price has been gradually declining over the past few days, and the situation does not look promising for XRP at the moment. Technical Analysis By Edris The USDT Paired Chart On the USDT-paired chart, the price has been struggling to rebound after the recent drop from the $0.9 resistance level. The 200-day moving average, located around the $0.5 mark, is also failing to hold the market, as the price has been closing below it in recent days. Considering the current...
Read More »Ripple Price Analysis: The Calm Before the Storm? XRP About to Lose Key Support
After a period of steady price movements, Ripple has finally moved – toward a bearish trajectory. This decline has led to a breakdown below a critical support zone defined by the 200-day moving average. Technical Analysis By Shayan The Daily Chart A closer look at the daily chart shows a notable drop in XRP price due to elevated selling pressure and an increasing bearish sentiment. The price slipped beneath the crucial 100-day MA at $0.55, reaching the 200-day moving average...
Read More »Ripple Price Analysis: XRP At Critical Support, Breakdown Could Lead to a Further Crush
Ripple’s price shows bearish signs; if the current key support level breaks – the drop could escalate even faster. Technical Analysis By Edris The USDT Paired Chart On the USDT paired chart, the price has held above the 200-day moving average, around the $0.5 mark, over the past few weeks. However, the price is currently testing the 200-day moving average. If this moving average breaks down, the price will drop quickly towards the $0.43 level. On the other hand, if the price...
Read More »Ripple Price Analysis: XRP Still in Danger Amid Sideways Action
Ripple’s price movement has been relatively stagnant, following a cascading downward trend. This decline led the price to a robust support area represented by the 200-day moving average. Technical Analysis By Shayan The Daily Chart Looking at the daily chart, the increased selling pressure and bearish sentiment are evident, resulting in a significant price decrease. This downward movement has disrupted the previous bullish trend and led to an extended rejection. Consequently,...
Read More »No Panic: XRP Can Rely on These Support Levels to Bounce (Ripple Price Analysis)
Ripple’s price is currently correcting after a significant surge following the win against SEC. However, there is little reason for concern as there are multiple support levels nearby. Technical Analysis By: Edris XRP/USDT Daily Chart: Against USDT, the price has been constantly declining after being rejected from the $0.9 resistance level. The market is likely targeting the 50-day moving average around the $0.6 support level. The 200-day moving average trending near the $0.5...
Read More » Crypto EcoBlog


