Duo Nine
June 9, 2023
Altcoins, Crypto news, Markets, Ripple (XRP)
This week, we take a closer look at Ripple, Cardano, Binance Coin, Solana, and Polygon.
Ripple (XRP)
Ripple continues to surprise the market with its strength, considering that in the past week, most altcoins ended up in red. More so, XRP has managed to close in green with a 2.6% increase in price, making it the best performer on our list today.
This resilience has taken the price just under the key resistance at 53 cents. Volatility also increased this week, and buyers...
Read More »
CryptoVizArt
June 8, 2023
Crypto news, Mining, Ripple (XRP)
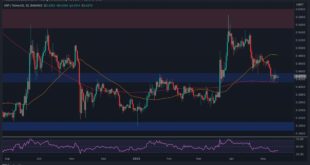
After breaking above both the 100-day moving average and the descending trendline, XRP has initiated a solid upward trend, reaching a significant resistance region at $0.55. The price action in this crucial zone will play a vital role in determining Ripple’s future direction.
Technical Analysis
By Shayan
The Daily Chart
Taking a closer look at the daily chart, once the price surpassed the 100-day moving average at $0.44, it went through a brief correction, testing the moving...
Read More »
CryptoVizArt
June 4, 2023
Crypto news, Markets, Ripple (XRP), Tether (USDT)
In recent weeks, Ripple’s price has displayed an upward trend, recovering from a notable support level. However, there is still a crucial resistance level that must fall for the market to enter a bullish phase in the coming months.
Technical Analysis
By: Edris
XRP/USDT Daily Chart:
The XRP price has consistently increased after bouncing back from the $0.43 support. This level has also been reinforced by the 200-day moving average, while the price has surpassed the 50-day...
Read More »
CryptoVizArt
June 1, 2023
Crypto news, Ripple (XRP), Tether (USDT)
Ripple’s price has shown bullish movement in recent weeks. However, there is a notable resistance level that needs to be overcome before a more sustained rally can be anticipated.
Technical Analysis
By: Edris
XRP/USDT Daily Chart:
XRP has displayed a consistent upward trend after being rejected from the 200-day moving average of around $0.4. Additionally, it has surpassed the 50-day moving average of around $0.45 and appears to be targeting the resistance zone at $0.6 in the...
Read More »
CryptoVizArt
May 29, 2023
Crypto news, Ripple (XRP)
Ripple’s overall outlook currently appears optimistic, with recent price movements indicating a bullish trend. Notably, the cryptocurrency has found support at both the 100-day and 200-day moving averages and has continued to rise.
As a result, there is potential to target the significant resistance at the $0.55 region.
Technical Analysis
By Shayan
The Daily Chart
After a period of consolidation and correction, the price found support around $0.41, which coincided with the...
Read More »
Duo Nine
May 26, 2023
Crypto news, Ethereum (ETH), Litecoin (LTC), Ripple (XRP)
This week, we take a closer look at Ethereum, Ripple, Cardano, Tron, and Litecoin.
Ethereum (ETH)
Ethereum’s volatility increased this past week but failed to break above the key resistance at $1,820. For this reason, the price is at a similar point to last week.
This consolidation under the key resistance is unlikely to last, and bulls appear eager to break away. On Tuesday, buyers briefly took the price over the key level, but sellers were quick to reverse the price action...
Read More »
CryptoVizArt
May 21, 2023
Crypto news, Markets, Ripple (XRP), Tether (USDT)
Ripple’s price is finally showing some bullishness following 4 weeks of downward movement. However, there are still some concerning signs on the charts.
Technical Analysis
By: Edris
XRP/USDT Daily Chart
The price has rebounded from the $0.43 support level, with the key 200-day moving average located around the same level. Currently, the 50-day moving average is being tested around the $0.47 mark, but XRP has yet to break above.
If a bullish breakout were to occur, a rally...
Read More »
CryptoVizArt
May 18, 2023
Crypto news, Ripple (XRP)
Ripple’s price has found support at the significant 200-day moving average at around $0.41, leading to a robust uptrend. Should it continue its surge, Ripple’s next destination will be the resistance zone at $0.56, but what if the bears take control?
Technical Analysis
By Shayan
The Daily Chart
Analyzing the daily chart reveals that following several weeks of rejection, the price has finally found support at the 200-day moving average of $0.41, initiating an upward trend....
Read More »
CryptoVizArt
May 15, 2023
Crypto news, Markets, Ripple (XRP), Tether (USDT)
Ripples price has been sinking over the last few months following a clear rejection from a key resistance level. It is currently within a decisive area, and the outcome would likely determine the mid-term trend of the market.
Technical Analysis
By: Edris
XRP/USDT Daily Chart
The price has been making lower highs and lows recently, following the significant rally in early May. The bearish reversal at the $0.6 area has initiated the current downtrend, but the cryptocurrency is...
Read More »
CryptoVizArt
May 12, 2023
Crypto news, Markets, Ripple (XRP)
Ripple’s price is currently hovering near a crucial support region which consists of both the 200-day moving average and the $0.41 price zone. A breach below this critical level could potentially trigger a significant downturn toward the descending trendline.
Technical Analysis
By Shayan
The Daily Chart
On the daily chart, it’s apparent that after the recent weeks of rejection, the price has arrived at a strong support area at the 200-day moving average of $0.41. Considering...
Read More »