After a 3-day recovery, Ethereum price continues its bearish momentumAgainst the US Dollar, Ethereum continued to struggle under the 0 markAgainst Bitcoin, ETH found weekly support (0.022 BTC) upon a mid-term trend line; however, the situation is fragileETH/USD: Ethereum Trades Under 0Key Resistance Levels: 0, 0, 0, 0Key Support Levels: 5, 0, , Last Thursday, we saw the heavy price movement that crashed Ethereum’s price to following Bitcoin’s 40% daily plunge. However, the cryptocurrency market had seen a mild recovery following the drop.Ethereum is now trading around 5, but looking for a break above 0, which is marked grey on the daily chart.Moreover, the price remains ‘trapped’ inside the yellow descending channel. This proves that the bears are
Topics:
Michael Fasogbon considers the following as important: ETH Analysis, ETHBTC, Ethereum (ETH) Price, ethusd
This could be interesting, too:
Mandy Williams writes Ethereum Derivatives Metrics Signal Modest Downside Tail Risk Ahead: Nansen
Jordan Lyanchev writes Weekly Bitcoin, Ethereum ETF Recap: Light at the End of the Tunnel for BTC
CryptoVizArt writes Will Weak Momentum Drive ETH to .5K? (Ethereum Price Analysis)
Jordan Lyanchev writes Bybit Hack Fallout: Arthur Hayes, Samson Mow Push for Ethereum Rollback
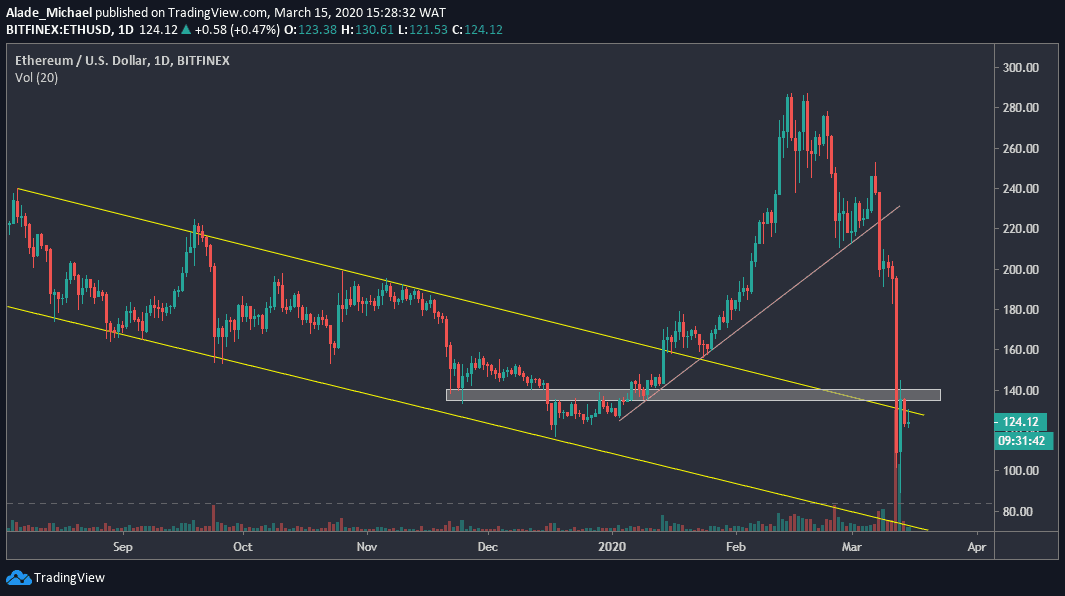
- After a 3-day recovery, Ethereum price continues its bearish momentum
- Against the US Dollar, Ethereum continued to struggle under the $140 mark
- Against Bitcoin, ETH found weekly support (0.022 BTC) upon a mid-term trend line; however, the situation is fragile
ETH/USD: Ethereum Trades Under $140
Key Resistance Levels: $140, $160, $180, $200
Key Support Levels: $115, $100, $86, $80
Last Thursday, we saw the heavy price movement that crashed Ethereum’s price to $86 following Bitcoin’s 40% daily plunge. However, the cryptocurrency market had seen a mild recovery following the drop.
Ethereum is now trading around $125, but looking for a break above $140, which is marked grey on the daily chart.
Moreover, the price remains ‘trapped’ inside the yellow descending channel. This proves that the bears are still controlling the market. As mentioned above, the key level is $140.
Whichever way the price goes would determine the next direction for ETH. As of now, Ethereum’s trend remains in a neutral-bearish mode.
Ethereum-USD Price Prediction
On the intraday trading, the ETHUSD pair is currently subdued with choppy price actions. On the upside, the initial resistance of $140 is a critical breakout level, followed by the $160 and $180 levels. Above these levels lies $200, around the opening price of the past week.
From below, the immediate support to watch out for is prominent $115 (Friday’s opening price). Below there is the psychological level of $100, followed by $86 (the weekly low). Further support may establish around $80 if Ethereum breaks lower.
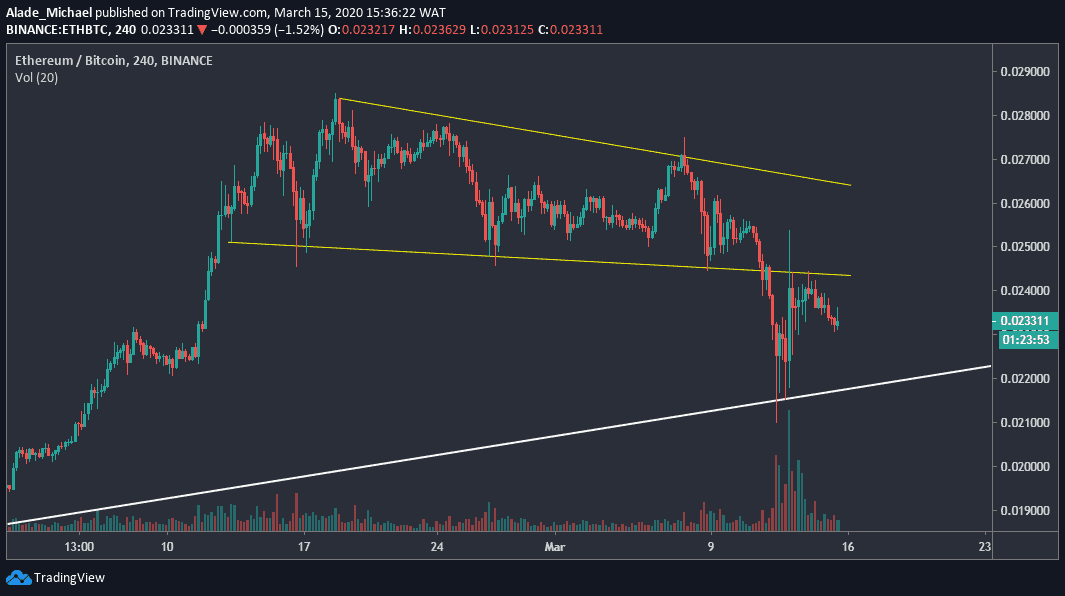
ETH/BTC: Ethereum Faces Weekly Support
Key Resistance Levels: 0.0244 BTC, 0.026 BTC
Key Support Levels: 0.022 BTC, 0.020 BTC
Against Bitcoin, Ethereum is showing weakness following a two-day pullback to the 0.0244 BTC resistance. The latter is the level where ETH broke down from while breaking down the wedge pattern on March 12.
After the breakdown, the price wicked at 0.021 BTC level, but Ethereum later found support around 0.022 BTC on a mid-term trend line, which is marked by white on the 4-hour chart. As of now, Ethereum is heading towards this support trend line again with the current trading price at 0.0233 BTC.
Ethereum could regain momentum if this trend line supports the coin one more time. If it fails, then the already four weeks bearishness could extend further.
Ethereum-BTC Price Prediction
In case Ethereum resumes the bearish pressure, the 0.022 BTC level is the closest support for the sellers. If the pressure extends beyond the weekly low, 0.021 BTC level, the next support would be the 0.020 BTC level.
From the other side, if Ethereum regains momentum, the buyers would face the 0.0244 BTC critical resistance. Further above is the 0.026 BTC, around the upper boundary of the wedge, before the February high.