The near-term pullback managed to find support at .5K and successfully held K on a daily closing basis. The significant rally with elevated open interest, high funding rates, and leverage ratios were all signals of caution. The open interest has been consolidating around .3 billion, and the funding rate also cooled down to neutral levels. The leverage ratio remains elevated, and it hit a recent high of .19 which is near the November 2020 peak. Chart by TradingViewTechnical Indicators of BTC Price It’s very good to see that the K level held with a push higher. In the short term, bitcoin’s price is making higher highs on the hourly chart, but we do need to see BTC make a higher low while also holding K. There was an early bullish divergence that was forming
Topics:
Daniel Joe considers the following as important: Bitcoin (BTC) Price, BTC Analysis, BTCEUR, BTCGBP, btcusd, btcusdt
This could be interesting, too:
Chayanika Deka writes XRP, SOL, and ADA Inclusion in US Crypto Reserve Pushes Traders on Edge
Chayanika Deka writes Why Arthur Hayes Is Bullish on Bitcoin Under Trump’s Economic Strategy
Mandy Williams writes Why the Bitcoin Market Is Stuck—and the Key Metric That Could Change It: CryptoQuant CEO
Wayne Jones writes Metaplanet Acquires 156 BTC, Bringing Total Holdings to 2,391
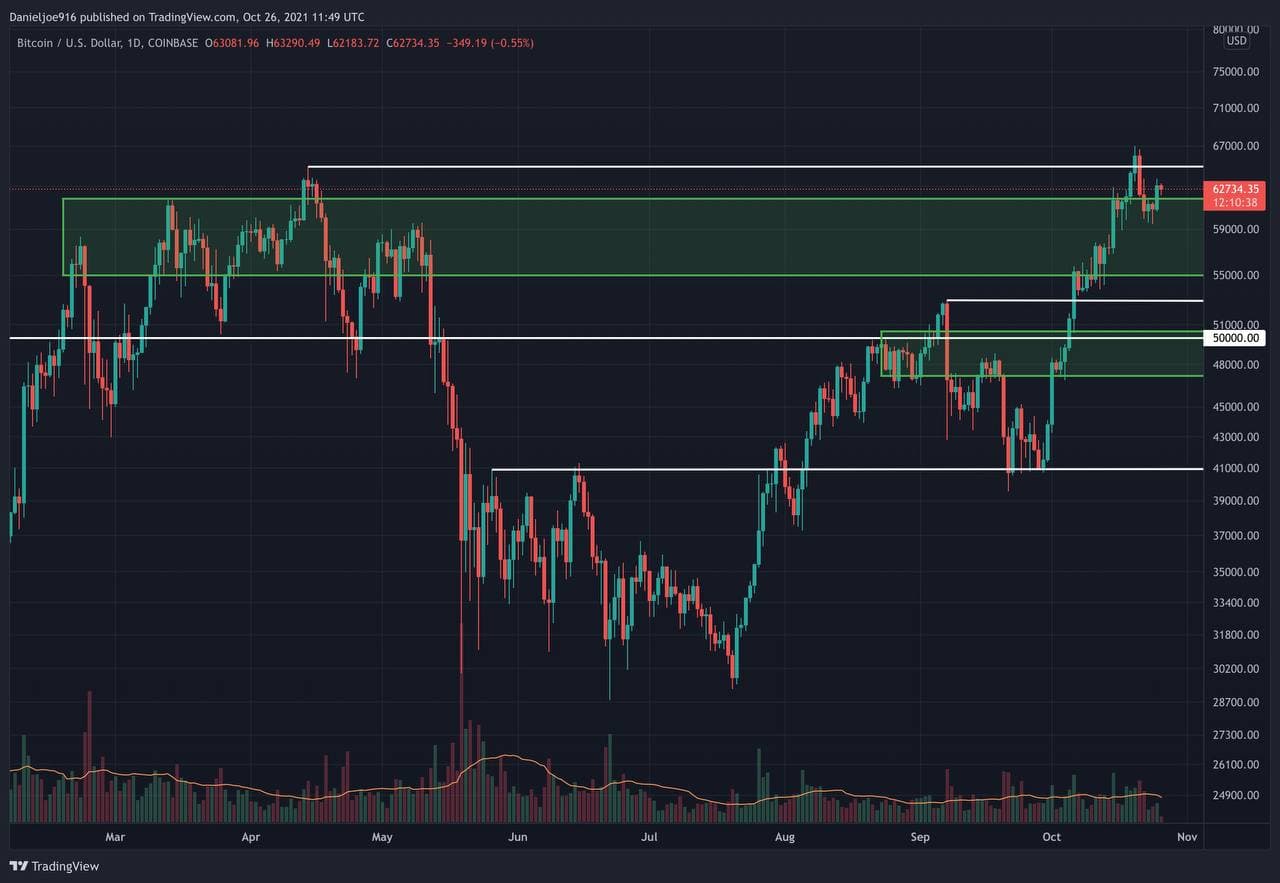
The near-term pullback managed to find support at $59.5K and successfully held $60K on a daily closing basis. The significant rally with elevated open interest, high funding rates, and leverage ratios were all signals of caution.
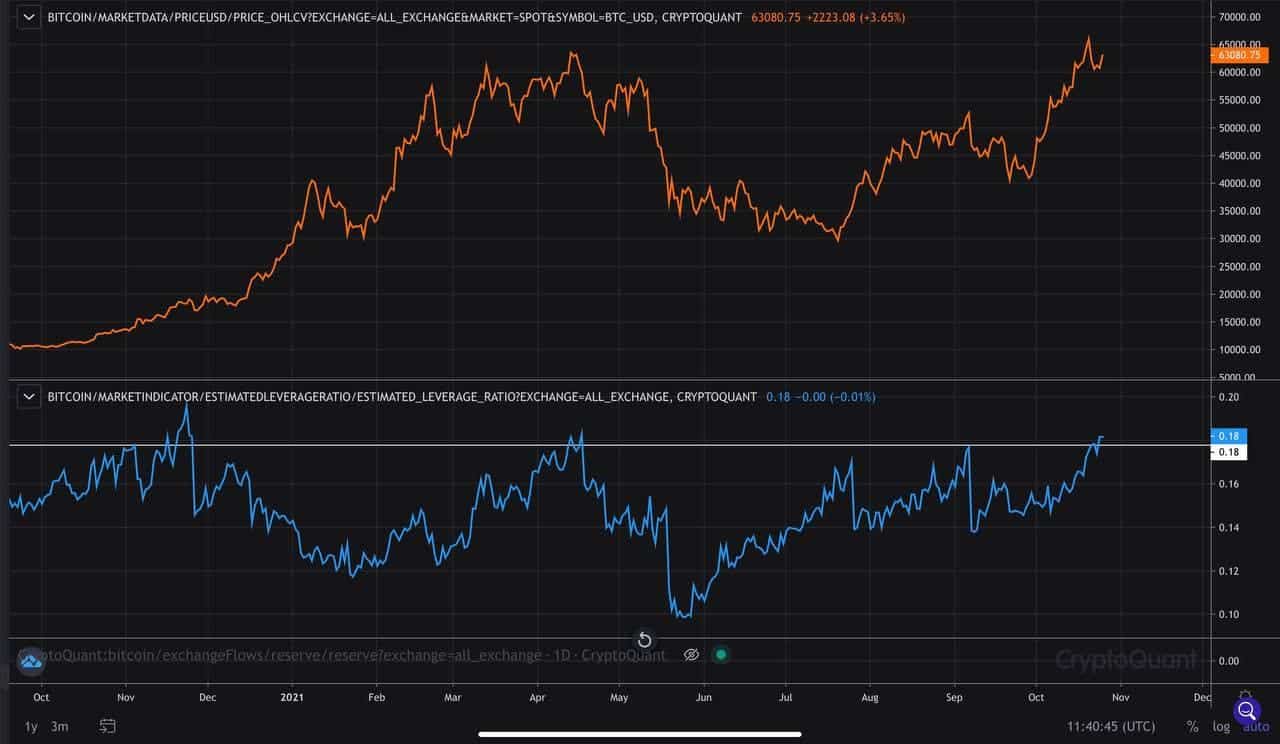
The open interest has been consolidating around $14.3 billion, and the funding rate also cooled down to neutral levels. The leverage ratio remains elevated, and it hit a recent high of .19 which is near the November 2020 peak.
Technical Indicators of BTC Price
It’s very good to see that the $60K level held with a push higher. In the short term, bitcoin’s price is making higher highs on the hourly chart, but we do need to see BTC make a higher low while also holding $60K.
There was an early bullish divergence that was forming for the past few days. Now, it’s important to reclaim the previous all-time high level at $64.8K to validate that the near-term pullback is complete.
On-Chain Metrics
The current leverage ratio and overall market structure look similar to that from November 2020. The leverage ratio reaching .18 has led to local tops, such as in September and April 2021. There’s an increased risk when the ratio stays near .18 and .20.
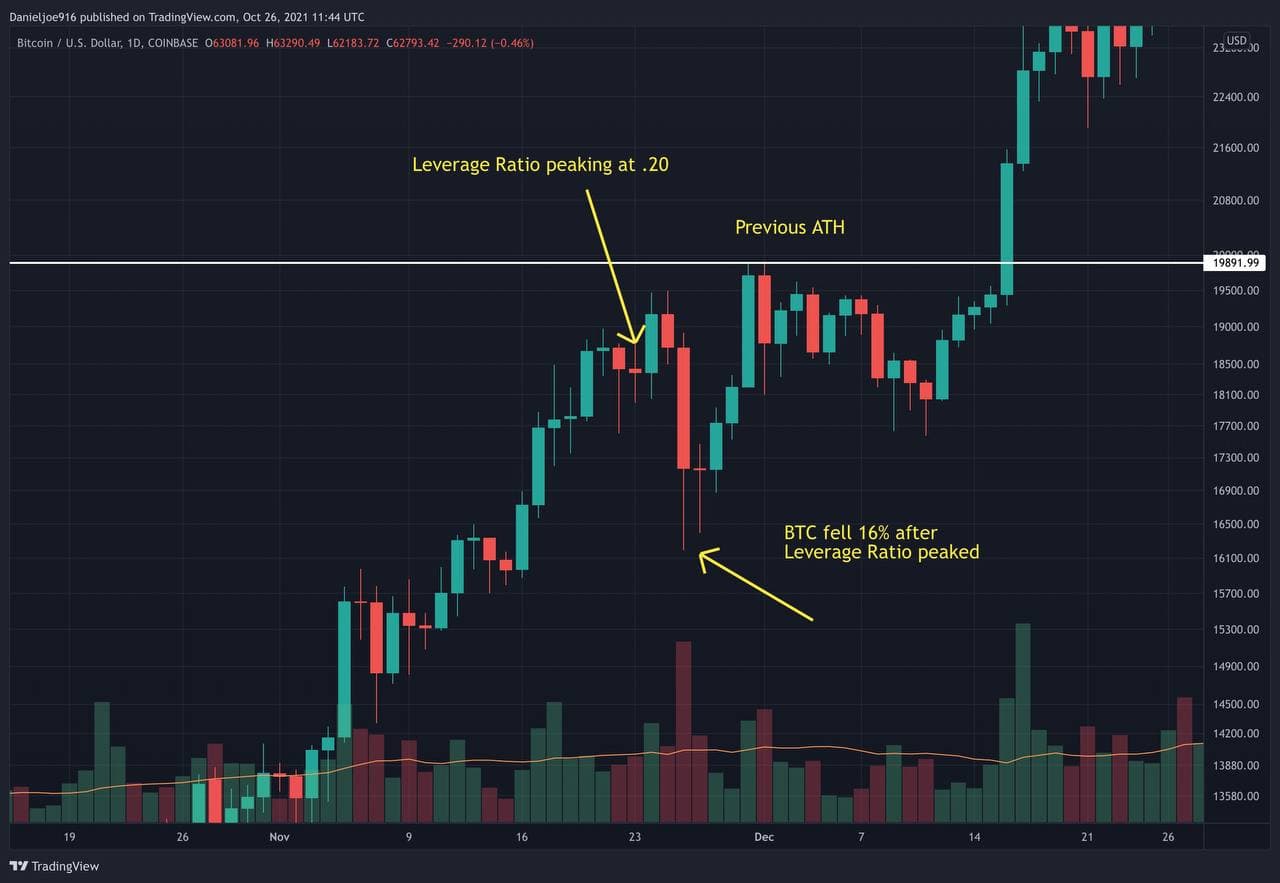
In November 2020, the leverage ratio peaked at .20, and this saw the BTC price retrace by 16% before it was able to make a new all-time high. The current chart looks similar. BTC managed to push slightly above the previous all-time high, but the elevated open interest, high funding rates, and leverage ratio caused an 11% pullback.
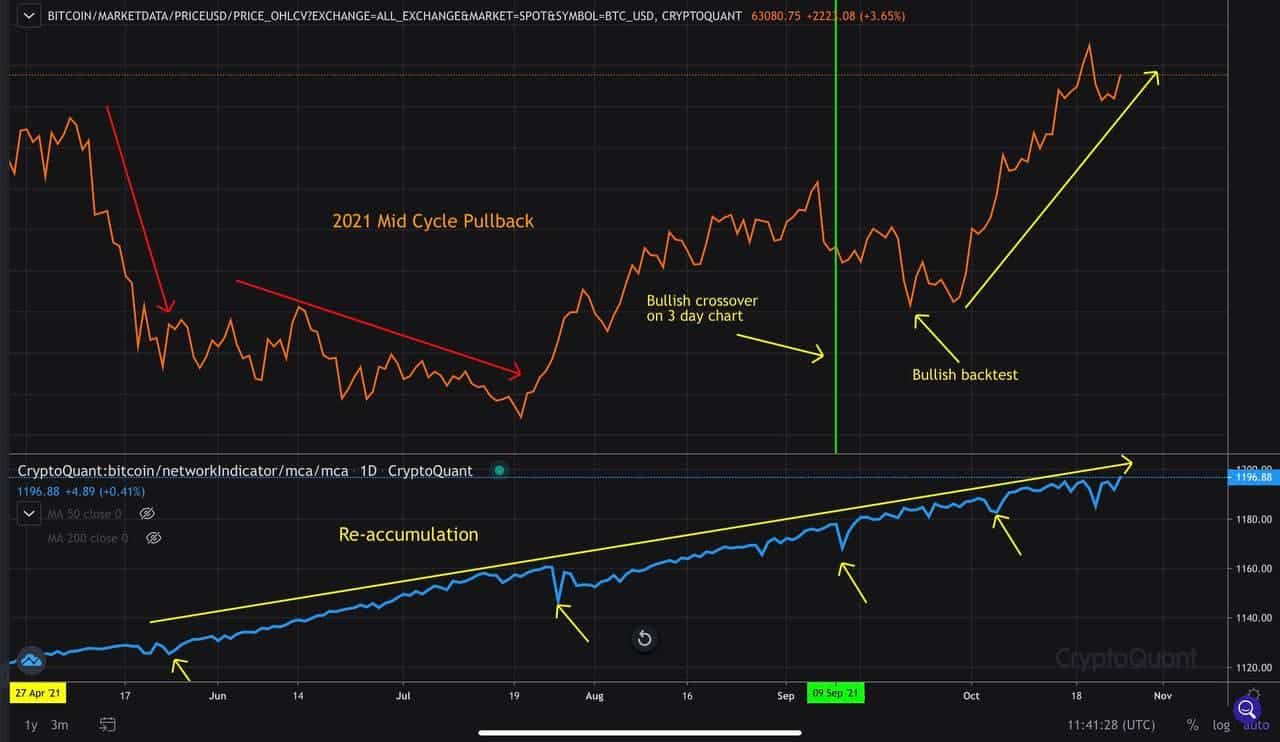
Given that the overall trend in fundamental and on-chain indicators remains firmly bullish, we should expect a bullish continuation once the pullback is complete. It’s highly likely for BTC to bottom between $60K and $53K – the September highs.
It’s also possible for BTC to be forming a cup and handle formation where the price retests previous all-time highs, pulls back and then pushes for a new peak.
Additionally, miners continue accumulating with reserves sitting at 1.85 million BTC. The Mean Coin Age made another all-time high which shows that long-term holders are not distributing aggressively. Some older coin cohorts are selling slightly, but there are no signs of a trend of distribution at the moment. This is bullish, considering that bitcoin’s price recently pushed above its all-time high and fell by 11% subsequently. Normally, in a bull trap, we would have seen long-term holders and miners distribute more aggressively while retail FOMOs into the market.
Data suggests that LTHs and miners continue expecting BTC’s price to push higher and refuse to sell large amounts. It’s important to note that they’ve historically been distributing during bull markets. The trend usually starts when the price appreciates rapidly and so, it’s important to monitor whenever it happens.
The supply continues to thin out, which makes bitcoin more difficult to accumulate on spot, especially for large institutions. Derivatives exchanges have been seeing big outflows lately, but most of them are likely internal transfers into new cold wallets. Regardless, BTC continues to be in considerable supply exhaustion as LTHs and miners continue to HODL.
Macro Overview of the BTC Price
The overall macro environment continues to favor risk assets, including Bitcoin. The dollar trends lower after topping at 94.47 earlier this month.
Stocks continue charting all-time highs, confirming that the risk-on trade is resuming. The low rate environment, central bank balance sheets soaring to new highs, and the dollar losing purchasing power continue making risk assets desirable, even though stocks might be fundamentally overvalued.
The overall trend in fundamentals, technicals, and on-chain metrics remains bullish for bitcoin’s price. It looks well-positioned going in Q4, and increased volatility to the upside might be expected.