ADA price is attempting a fresh increase above the %excerpt%.250 zone against the US Dollar. The price is now trading above %excerpt%.250 and the 55 simple moving average (4 hours). There was a break above a key bearish trend line with resistance near %excerpt%.2515 on the 4-hour chart (data feed via Coinbase). The price could gain bullish momentum if it clears the %excerpt%.2555 and %excerpt%.2600 levels. Cardano price is holding the %excerpt%.250 support against the US Dollar, like Bitcoin. ADA price could gain bullish momentum if it clears the %excerpt%.260 resistance. Cardano Price Analysis This past week, Cardano price saw a decent upward move from the %excerpt%.236 support against the US Dollar. The ADA/USD pair was able to climb above the %excerpt%.245 and %excerpt%.250 resistance levels. During the increase, the bulls
Topics:
Aayush Jindal considers the following as important: ADA, Altcoin News, Cardano, News, Trading
This could be interesting, too:
Bitcoin Schweiz News writes Meme Coins frühzeitig entdecken: So gelingt der Einstieg vor dem Hype
Bitcoin Schweiz News writes Bitpanda vs. Binance: Welche Bitcoin-App ist die beste für die Schweiz?
Chayanika Deka writes XRP, SOL, and ADA Inclusion in US Crypto Reserve Pushes Traders on Edge
Bilal Hassan writes Morocco Cracks Down on Crypto Property Deals
- ADA price is attempting a fresh increase above the $0.250 zone against the US Dollar.
- The price is now trading above $0.250 and the 55 simple moving average (4 hours).
- There was a break above a key bearish trend line with resistance near $0.2515 on the 4-hour chart (data feed via Coinbase).
- The price could gain bullish momentum if it clears the $0.2555 and $0.2600 levels.
Cardano price is holding the $0.250 support against the US Dollar, like Bitcoin. ADA price could gain bullish momentum if it clears the $0.260 resistance.
Cardano Price Analysis
This past week, Cardano price saw a decent upward move from the $0.236 support against the US Dollar. The ADA/USD pair was able to climb above the $0.245 and $0.250 resistance levels.
During the increase, the bulls pushed the price above the 50% Fib retracement level of the downward move from the $0.2609 swing high to the $0.2365 low. Besides, there was a break above a key bearish trend line with resistance near $0.2515 on the 4-hour chart.
ADA is now trading above $0.250 and the 55 simple moving average (4 hours). On the upside, immediate resistance is near the $0.2555 zone. It is close to the 76.4% Fib retracement level of the downward move from the $0.2609 swing high to the $0.2365 low.
The next major resistance is near the $0.260 level. A clear move above the $0.260 resistance might start a steady increase. In the stated case, the price may perhaps rise toward the $0.275 resistance or even $0.288 in the near term.
On the downside, immediate support is near the $0.252 level. The next major support is near the $0.250 level or the 55 simple moving average (4 hours).
A clear move below the $0.250 level might send the price toward the $0.245 level. Any more losses might send the price toward the $0.236 support, below which the bears could aim for a test of $0.220.
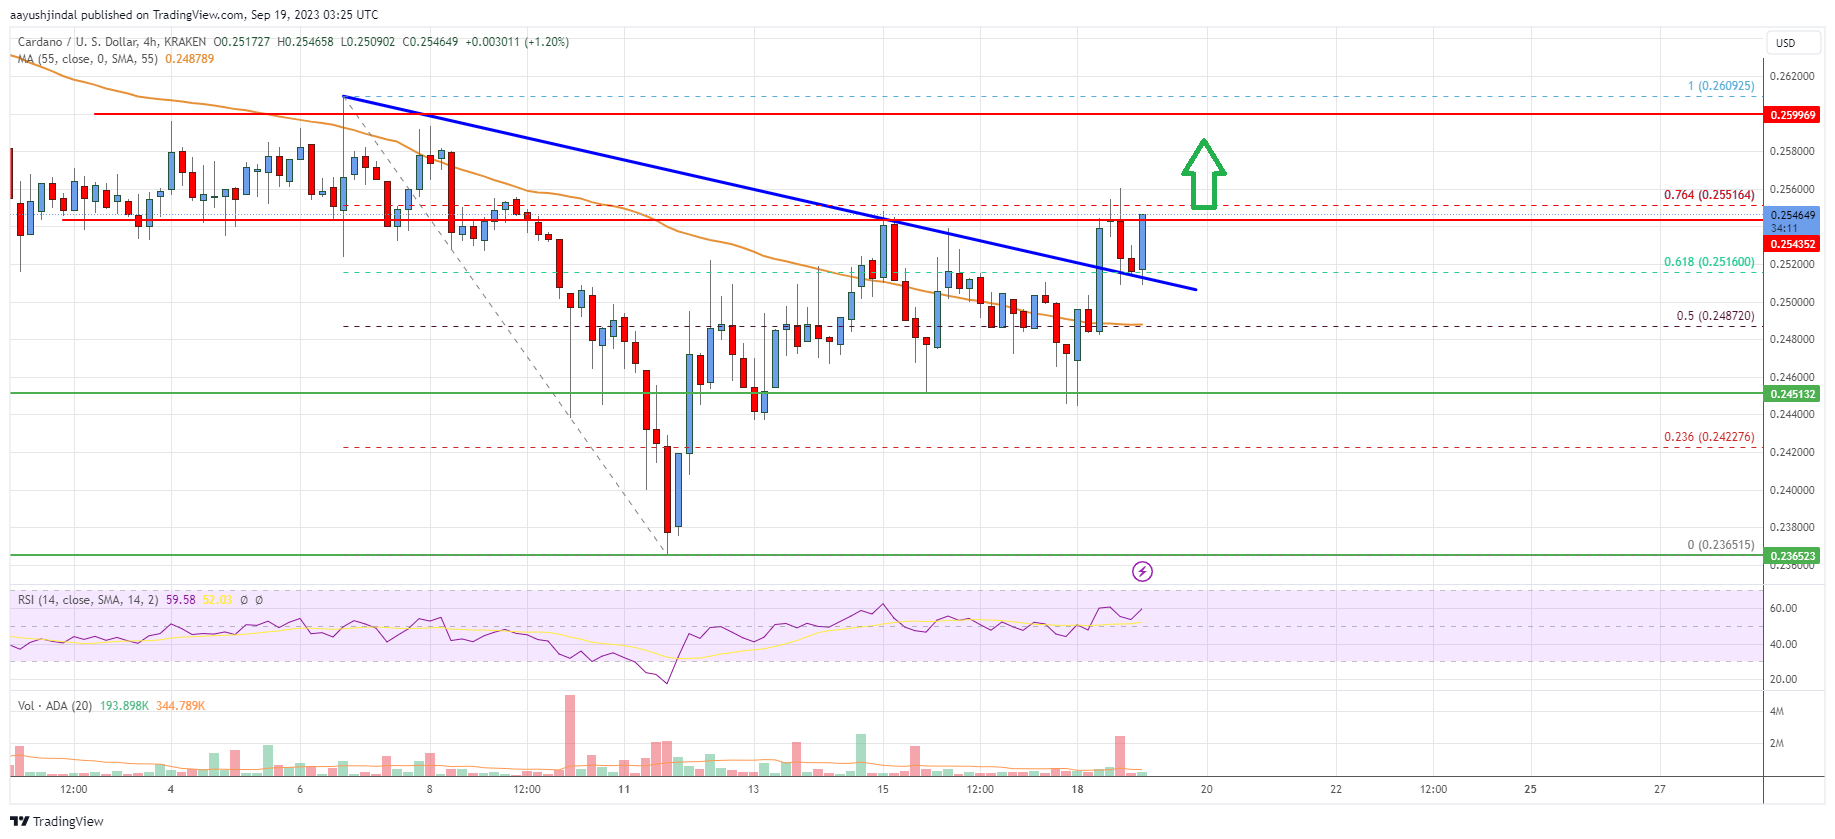
The chart indicates that ADA price is now trading above $0.250 and the 55 simple moving average (4 hours). Overall, the price could gain bullish momentum if it clears the $0.2555 and $0.2600 levels.
Technical Indicators
4 hours MACD – The MACD for ADA/USD is now gaining pace in the bullish zone.
4 hours RSI – The RSI for ADA/USD is now above the 50 level.
Key Support Levels – $0.250 and $0.245.
Key Resistance Levels – $0.2555 and $0.260.