ADA price is trading in a bearish zone below the %excerpt%.258 support zone against the US Dollar. The price is now trading below %excerpt%.255 and the 55 simple moving average (4 hours). There was a break below a key bullish trend line with support at %excerpt%.2560 on the 4-hour chart (data feed via Coinbase). The price could continue to move down if it stays below the %excerpt%.258 resistance zone. Cardano price is struggling below %excerpt%.258 against the US Dollar, like Bitcoin. ADA price could start a fresh increase if it clears the %excerpt%.255 and %excerpt%.258 resistance levels. Cardano Price (ADA) Analysis In the past few days, Cardano price started a fresh decline from the %excerpt%.2680 resistance against the US Dollar. The ADA/USD pair declined below the %excerpt%.262 and %excerpt%.260 support levels. The price
Topics:
Aayush Jindal considers the following as important: ADA, Altcoin News, Cardano, News, Trading
This could be interesting, too:
Bitcoin Schweiz News writes Meme Coins frühzeitig entdecken: So gelingt der Einstieg vor dem Hype
Bitcoin Schweiz News writes Bitpanda vs. Binance: Welche Bitcoin-App ist die beste für die Schweiz?
Chayanika Deka writes XRP, SOL, and ADA Inclusion in US Crypto Reserve Pushes Traders on Edge
Bilal Hassan writes Morocco Cracks Down on Crypto Property Deals
- ADA price is trading in a bearish zone below the $0.258 support zone against the US Dollar.
- The price is now trading below $0.255 and the 55 simple moving average (4 hours).
- There was a break below a key bullish trend line with support at $0.2560 on the 4-hour chart (data feed via Coinbase).
- The price could continue to move down if it stays below the $0.258 resistance zone.
Cardano price is struggling below $0.258 against the US Dollar, like Bitcoin. ADA price could start a fresh increase if it clears the $0.255 and $0.258 resistance levels.
Cardano Price (ADA) Analysis
In the past few days, Cardano price started a fresh decline from the $0.2680 resistance against the US Dollar. The ADA/USD pair declined below the $0.262 and $0.260 support levels.
The price even declined below the $0.258 support and the 55 simple moving average (4 hours). Besides, there was a break below a key bullish trend line with support at $0.2560 on the 4-hour chart. It revisited the $0.250 support zone. A low has formed near $0.2490 and the price is now consolidating losses.
There was a minor increase toward the 23.6% Fib retracement level of the downward move from the $0.2672 swing high to the $0.2490 low.
On the upside, immediate resistance is near the $0.2540 zone. The first major resistance is near the $0.258 level or the 55 simple moving average (4 hours). It is close to the 50% Fib retracement level of the downward move from the $0.2672 swing high to the $0.2490 low.
The next key resistance could be $0.268. A clear upside break above the $0.268 level might send the price toward the $0.288 resistance. Any more gains could start a steady increase toward the $0.300 level or even $0.312.
On the downside, immediate support is near the $0.249 level. The next major support is near the $0.242 level, below which the price may perhaps decline toward the $0.220 support level. Any more losses might call for a test of the $0.20 level.
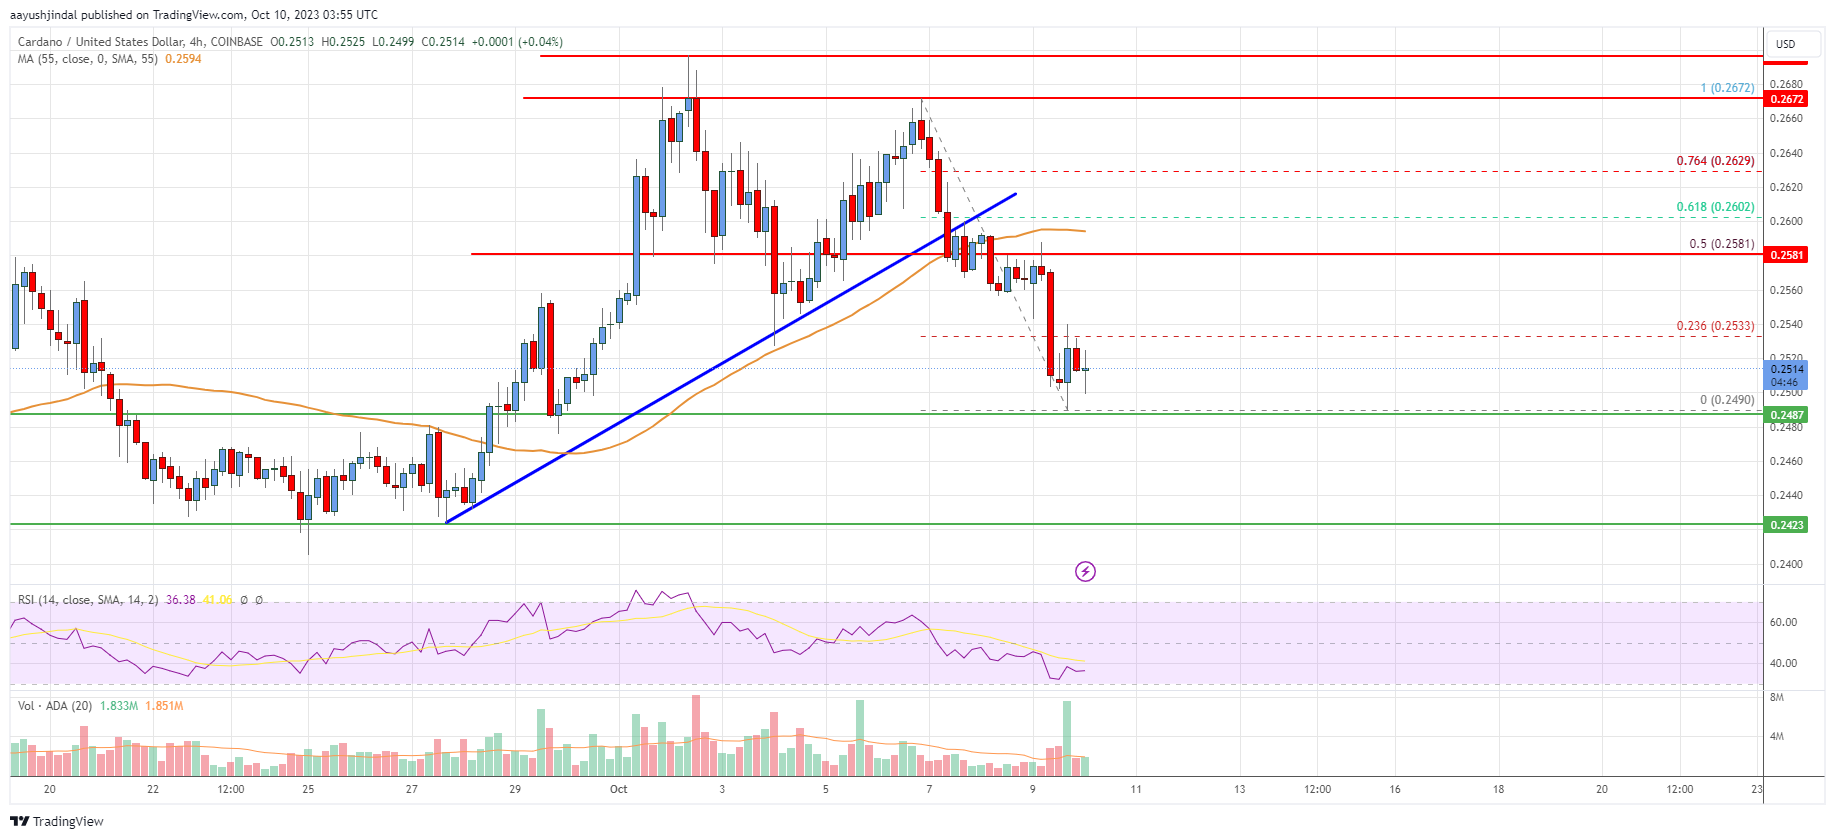
The chart indicates that ADA price is now trading below $0.255 and the 55 simple moving average (4 hours). Overall, the price could continue to move down if it stays below the $0.258 resistance zone.
Technical Indicators
4 hours MACD – The MACD for ADA/USD is now losing pace in the bearish zone.
4 hours RSI – The RSI for ADA/USD is now below the 50 level.
Key Support Levels – $0.2490 and $0.2420.
Key Resistance Levels – $0.2550 and $0.2580.