Ethereum price is struggling below the ,640 resistance against the US Dollar. ETH price is now trading below ,620 and the 55 simple moving average (4 hours). There is a key bearish trend line forming with resistance near ,600 on the 4-hour chart (data feed from Coinbase). The pair could continue to move down if it stays below ,600 and ,620. Ethereum price is declining below ,620 against the US Dollar. ETH/USD remains at a risk of more downsides if it fails to recover above ,650. Ethereum Price Analysis This past week, Ethereum struggled to stay above the ,660 level against the US Dollar. ETH price started a fresh decline and traded below the ,650 pivot level. It traded below ,640 and ,620 support levels to enter a bearish zone. There was
Topics:
Aayush Jindal considers the following as important: Altcoin News, ETH, News, Trading
This could be interesting, too:
Bitcoin Schweiz News writes Meme Coins frühzeitig entdecken: So gelingt der Einstieg vor dem Hype
Bitcoin Schweiz News writes Bitpanda vs. Binance: Welche Bitcoin-App ist die beste für die Schweiz?
Bilal Hassan writes Morocco Cracks Down on Crypto Property Deals
Bilal Hassan writes Crypto Becomes a U.S. ‘Weapon,’ Says CryptoQuant CEO
- Ethereum price is struggling below the $1,640 resistance against the US Dollar.
- ETH price is now trading below $1,620 and the 55 simple moving average (4 hours).
- There is a key bearish trend line forming with resistance near $1,600 on the 4-hour chart (data feed from Coinbase).
- The pair could continue to move down if it stays below $1,600 and $1,620.
Ethereum price is declining below $1,620 against the US Dollar. ETH/USD remains at a risk of more downsides if it fails to recover above $1,650.
Ethereum Price Analysis
This past week, Ethereum struggled to stay above the $1,660 level against the US Dollar. ETH price started a fresh decline and traded below the $1,650 pivot level.
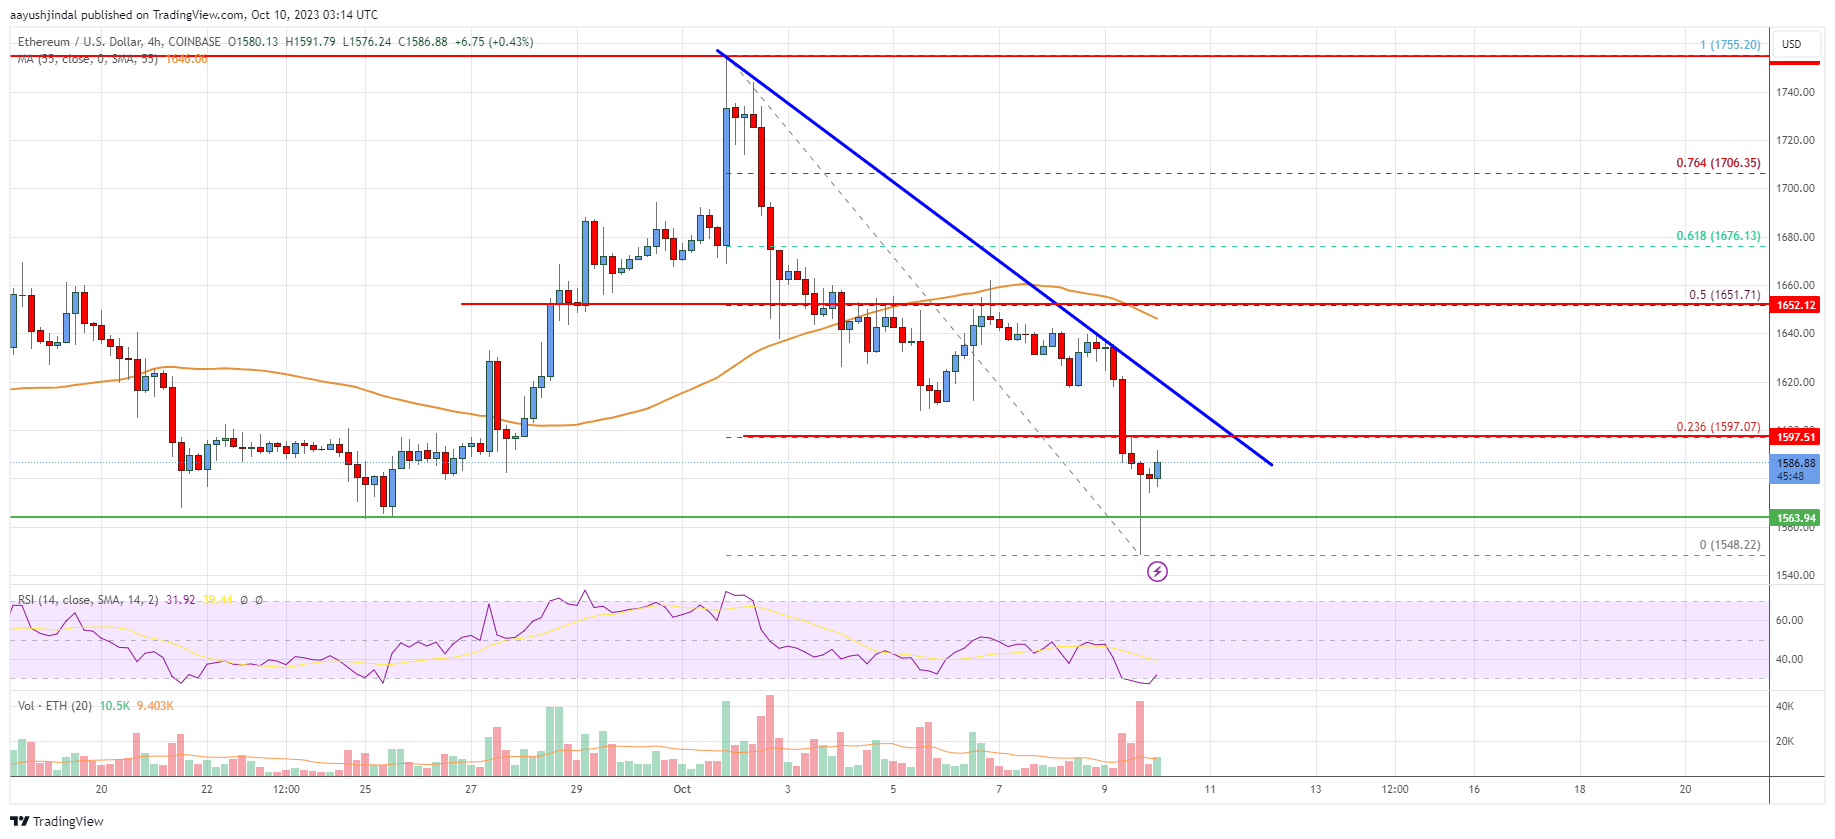
It traded below $1,640 and $1,620 support levels to enter a bearish zone. There was also a break below the $1,600 level. A low is formed near $1,548 and the price is now correcting losses. ETH is now trading below $1,620 and the 55 simple moving average (4 hours).
There is also a key bearish trend line forming with resistance near $1,600 on the 4-hour chart. The trend line is near the 23.6% Fib retracement level of the downward move from the $1,755 swing high to the $1,548 low.
On the upside, the price is now facing resistance near the $1,600 level and the trend line. The next major resistance is near the $1,620 level. The main resistance is now forming near the $1,650 level. It is close to the 50% Fib retracement level of the downward move from the $1,755 swing high to the $1,548 low, above which the price could test the $1,675 resistance.
A clear move above the $1,675 resistance could send the price toward $1,750. On the downside, initial support is near the $1,560 level. The next major support is now near the $1,540 level. A break below the $1,540 support could push the price to $1,480. If the bulls fail to protect the $1,480 support, the price might decline toward $1,350.
Looking at the chart, Ethereum price is trading below $1,620 and the 55 simple moving average (4 hours). Overall, Ether’s price could continue to move down if it stays below $1,620 and $1,650.
Technical indicators
4 hours MACD – The MACD for ETH/USD is now gaining momentum in the bearish zone.
4 hours RSI (Relative Strength Index) – The RSI for ETH/USD is now below the 50 level.
Key Support Levels – $1,560, followed by the $1,540 zone.
Key Resistance$ Levels – $1,600 and $1,650.