CryptoVizArt
October 8, 2024
Bitcoin (BTC), Crypto news
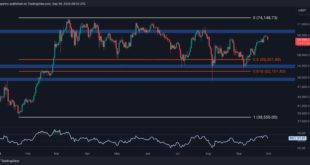
Bitcoin’s price has yet to recover above the key 200-day moving average, and if things remain the same, it is seemingly bound to drop to lower levels.
Technical Analysis
By Edris Derakhshi (TradingRage)
The Daily Chart
On the daily chart, the price has recently rebounded from the $60K support level following the breakdown below $64K and the 200-day moving average, located around the same area.
Meanwhile, these levels are currently preventing the price from rising, as...
Read More »
CryptoVizArt
September 30, 2024
Bitcoin (BTC), Crypto news, Markets, Mining
Bitcoin’s recent price surge toward $66,000 has led to heightened optimism, but the market now faces a potential retracement phase.
The $66K resistance level is proving to be a formidable barrier, and BTC is likely to undergo a period of consolidation or correction before determining its next major trend.
Technical Analysis
By Shayan
The Daily Chart
Bitcoin recently experienced a strong bullish surge, reaching the critical $66K resistance region after originating from a...
Read More »
CryptoVizArt
September 28, 2024
Bitcoin (BTC), Crypto news, Markets
Bitcoin’s price has broken post a key level recently and is seemingly targeting a new all-time high in the short term.
Technical Analysis
By Edris Derakhshi (TradingRage)
The Daily Chart
On the daily chart, the price has finally broken above the $64K level and the 200-day moving average, which is located around the same mark.
With the RSI also showing a clear bullish momentum, the cryptocurrency will likely continue its uptrend toward the $68K resistance zone in the short...
Read More »
CryptoVizArt
September 26, 2024
Bitcoin (BTC), Crypto news, Markets
Bitcoin’s price is currently at a critical level, and its reaction will likely determine the mid-term trend of the entire crypto market.
Technical Analysis
By Edris Derakhshi (TradingRage)
The Daily Chart
On the daily chart, the asset has been rallying since it rebounded from the $52K support level and has broken both the $56K and $60K levels to the upside with momentum. However, the market has finally reached the 200-day moving average, which coincides with the key $64K...
Read More »
CryptoVizArt
September 18, 2024
Bitcoin (BTC), Crypto news, Markets
Bitcoin’s price finally looks set to break back above the $60K level after weeks of consolidation. However, there is still one more key resistance level that the price needs to overcome.
Technical Analysis
By: Edris Derakhshi (TradingRage)
The Daily Chart
On the daily timeframe, Bitcoin’s price is demonstrating a willingness to finally break above the $60K resistance level, following its rebound from $52K.
The RSI also shows values above 50, indicating that the market...
Read More »
George Georgiev
September 16, 2024
Bitcoin (BTC), Crypto news, Markets
Bitcoin’s price is still consolidating around the $60K level. Yet, an impulsive move might begin soon.
Technical Analysis
By Edris Derakhshi (TradingRage)
The Daily Chart
On the daily timeframe, it is evident that the price has yet to climb back and recover definitively above the $60K level after its rapid rejection and drop from the 200-day moving average, located around $63K.
Following the recent rebound from the $52,500 level, the price has once again tested the pivotal...
Read More »
CryptoVizArt
September 15, 2024
Bitcoin (BTC), Crypto news, Markets
Bitcoin has recently experienced a strong bullish reversal from a critical support zone, defined by the 0.5 and 0.618 Fibonacci levels.
BTC is now approaching the 100-day moving average at $61.6K, where it may encounter significant selling pressure, suggesting a potential short-term consolidation.
Technical Analysis
By Shayan
The Daily Chart
A closer examination of Bitcoin’s daily chart reveals that after a decline toward the key support zone between the 0.5 ($56.3K) and...
Read More »
CryptoVizArt
August 29, 2024
Bitcoin (BTC), Crypto news
Bitcoin’s price has yet to recover from the recent drop, consolidating without a clear indication of its future direction. However, there are some signs that it could drop further if it’s unable to overcome $60,000 soon.
Recall that the largest digital asset slumped hard on Tuesday, dropping from over $63,000 to $58,000, before recovering slightly to its current levels of $60,000.
Technical Analysis
By TradingRage
The Daily Chart
On the daily timeframe, the asset has recently...
Read More »
CryptoVizArt
August 23, 2024
Bitcoin (BTC), Crypto news, Markets
Bitcoin’s price has been holding strong around the $60K level following the significant crash a few weeks ago. Investors are now optimistic that the market will soon rally to new all-time highs.
Technical Analysis
By TradingRage
The Daily Chart
On the daily timeframe, the price has been consolidating during the last couple of weeks after recovering from the $50K mark.
Yet, the 200-day moving average, located around $63K, is yet to be broken to the upside. A bullish breakout...
Read More »
CryptoVizArt
August 21, 2024
Bitcoin (BTC), Crypto news, Markets
Bitcoin’s price has yet to recover following the crash from $68K a couple of weeks ago.
The cryptocurrency has been consolidating in a tight range, leaving market participants wondering about its future direction.
BTC Price Technical Analysis
By TradingRage
The Daily Chart
The daily chart shows that the BTC price has failed to climb back above the 200-day moving average, located around the $63K mark, after dropping below it earlier. The market is now consolidating around the...
Read More »