CryptoVizArt
April 20, 2024
Bitcoin (BTC), Crypto news, Markets
Bitcoin’s price has been consolidating since early March, failing to continue its uptrend. Yet, the cryptocurrency might soon get back on track and create a new all-time high.
Bitcoin Price Analysis: Technicals
By TradingRage
The Daily Chart
On the daily chart, the Bitcoin price has been consolidating between the $60K and $70K levels over the past couple of weeks. The recent rejection from the $70K zone has driven it down toward the $60K support level.
Yet, the level has held...
Read More »
CryptoVizArt
April 5, 2024
Bitcoin (BTC), Crypto news, Markets
Bitcoin’s price is currently consolidating below the $70K level, failing to continue its rally and make a higher all-time high. Yet, investors remain optimistic as no worrying signs are surfacing yet.
Technical Analysis
By TradingRage
The Daily Chart
On the daily chart, the price has been hovering around the $70K mark and is yet to show a prolonged movement to either side.
The $68K resistance level is currently being tested, but the price has not been able to break it to the...
Read More »
CryptoVizArt
March 31, 2024
Bitcoin (BTC), Crypto news, Markets
Bitcoin’s price has recovered from its sudden drop from $75K and is currently targeting the same level again. Market participants are eagerly waiting for the market to make a new record high soon.
Technical Analysis
By TradingRage
The Daily Chart
On the daily chart, the price has rebounded from the $60K support zone and broken the $69K resistance level to the upside. BTC is currently climbing toward the $75K resistance once more.
The Relative Strength Index is also showing...
Read More »
CryptoVizArt
March 15, 2024
Bitcoin (BTC), Crypto news, Markets
Bitcoin’s price has finally corrected after weeks of aggressive rallying. It dropped by around 10% recently, leaving market participants wondering whether a deeper crash should be expected.
Technical Analysis
By TradingRage
The Daily Chart
Looking at the daily chart, the price has been rallying over the last few months, consistently making higher highs and lows. Yet, the $75K resistance level rejected Bitcoin lower, and the market is currently dropping below the $68K support...
Read More »
CryptoVizArt
March 10, 2024
Bitcoin (BTC), Crypto news
Bitcoin’s price is finally showing signs of breaking the previous all-time high to the upside.
Cryptocurrency is entering uncharted territories, and predicting its upside potential becomes a lot more challenging. However, there are some hints interpreted from technical and on-chain analysis.
Technical Analysis
By TradingRage
The Daily Chart
On the daily timeframe, the price is finally breaking the previous all-time high to the upside, with the price climbing toward the $70K...
Read More »
CryptoVizArt
March 6, 2024
Bitcoin (BTC), Crypto news, Markets
Bitcoin has achieved a significant milestone by reaching its all-time high of $69K after 847 days, reflecting a notable surge in confidence within the cryptocurrency market.
However, this achievement is accompanied by expectations of heightened volatility in the mid-term, leading to the liquidation of numerous futures market positions.
Technical Analysis
By Shayan
The Daily Chart
A detailed examination of the daily chart highlights Bitcoin’s impressive rally, driven by...
Read More »
CryptoVizArt
March 2, 2024
Bitcoin (BTC), Crypto news, Markets
Bitcoin’s price has been on an almost vertical rise in the last few days, approaching its all-time high of $69K. Yet, the cryptocurrency might not make a new record right away, as some warning signals are pointing to a short-term correction.
Technical Analysis
By TradingRage
The Daily Chart
On the daily timeframe, it is evident that the price has been rallying aggressively during the last month, breaking past several significant resistance levels. The market is currently one...
Read More »
CryptoVizArt
February 26, 2024
Bitcoin (BTC), Crypto news, Markets
Bitcoin’s price has been making higher highs and lows consistently over the past few months. However, the market is currently consolidating around a key resistance level, failing to continue higher.
Technical Analysis
By TradingRage
The Daily Chart
On the daily timeframe, the price has been breaking through several resistance levels since rebounding from the $40K support zone. Yet, the market is currently hovering around the $52K resistance level.
While there are no serious...
Read More »
CryptoVizArt
February 24, 2024
Bitcoin (BTC), Crypto news, Markets
Bitcoin’s price has entered a sideways consolidation phase following a notable surge toward the $52K resistance level, leaving market participants uncertain about its next direction. However, a short-term correction seems likely.
Technical Analysis
By Shayan
The Daily Chart
Analysis of the daily chart reveals a prolonged bull market for Bitcoin, characterized by its upward movement within a clearly defined ascending channel. This pattern indicates strong buyer dominance,...
Read More »
CryptoVizArt
February 19, 2024
Bitcoin (BTC), Crypto news, Markets
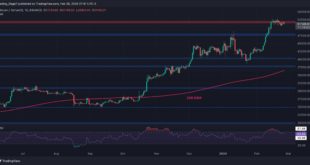
Bitcoin’s price has been rallying consistently over the last few weeks, breaking past several resistance levels. Yet, some worrying signs are starting to emerge.
Technical Analysis
By TradingRage
The Daily Chart
On the daily chart, the price has rallied toward the $52K resistance level after a rebound from $40K earlier in January. While the market is testing the $52K level, the Relative Strength Index is demonstrating a clear overbought signal.
This could point to a...
Read More »