CryptoVizArt
August 17, 2024
Bitcoin (BTC), Crypto news, Markets
Bitcoin’s price is consolidating in a tight range as market participants are uncertain about the future direction of the price.
Technical Analysis
By TradingRage
The Daily Chart
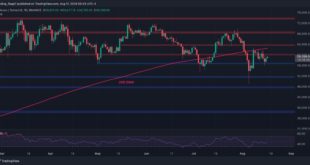
On the daily chart, the price has recently rebounded from the $50K area, following the significant drop below the 200-day moving average. Currently, the market is consolidating below the moving average, which is located around the $63K mark, failing to climb back above.
Meanwhile, the $56K support...
Read More »
George Georgiev
August 11, 2024
Bitcoin (BTC), Crypto news
Following a significant downtrend, Bitcoin found strong support near the $50K threshold and experienced a notable rebound.
However, the price has now approached a substantial resistance region around the 200-day moving average at $61K, potentially completing a pullback.
Technical Analysis
By Shayan
The Daily Chart
A detailed examination of Bitcoin’s daily chart reveals a significant increase in buying pressure and demand near the critical $50K support region, resulting in a...
Read More »
CryptoVizArt
August 3, 2024
Bitcoin (BTC), Crypto news, Markets
Bitcoin’s price experienced a significant drop yesterday following the breakdown of the $64K support level. The price is now in a key area that could determine the crypto market’s mid-term fate.
Technical Analysis
By TradingRage
The Daily Chart
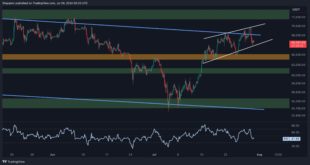
On the daily chart, the price has been dropping since creating a double top pattern at the $68K resistance level. The $64K level has also been broken down to the downside, and the cryptocurrency is testing the 200-day moving average....
Read More »
CryptoVizArt
July 30, 2024
Bitcoin (BTC), Crypto news, Markets
Following an impulsive rally, Bitcoin lost its bullish momentum upon reaching the $70K threshold, indicating the presence of sellers in the market.
Nevertheless, considering that the price is hovering above the crucial 100-day MA, the continuation of the consolidation stage seems possible in the short term before initiating the next move.
Technical Analysis
By Shayan
The Daily Chart
A detailed analysis of Bitcoin’s daily chart reveals that after decisively breaking above the...
Read More »
CryptoVizArt
July 22, 2024
Bitcoin (BTC), Crypto news, Markets
Bitcoin’s price has been rallying aggressively in the past couple of weeks, making its way toward a new record high.
Technical Analysis
By TradingRage
The Daily Chart
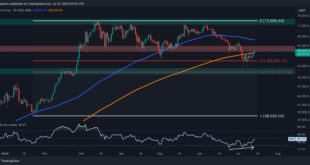
On the daily timeframe, the BTC price has been climbing higher since rebounding from the $56K support level and the 200-day moving average.
The market has reclaimed both the $60K and the $65K marks and is currently testing $68K – the last obstacle in the way of a new all-time high.
With the RSI also indicating...
Read More »
CryptoVizArt
July 21, 2024
Bitcoin (BTC), Crypto news, Markets
Bitcoin’s recovery is going well, and the market is seemingly on the verge of creating a new all-time high in the short term.
Technical Analysis
By TradingRage
The Daily Chart
As the daily chart depicts, Bitcoin’s price has been rallying since it rose above the 200-day moving average.
The market has also reclaimed the $60K and $65K levels and is moving toward the $68K resistance zone, which could be the last obstacle before creating a new all-time high. With the RSI also...
Read More »
CryptoVizArt
July 18, 2024
Bitcoin (BTC), Crypto news, Markets
Bitcoin’s price has recently recovered from a month of bearish price action. Considering the current upward momentum, the market might even make a new all-time high soon.
Technical Analysis
By TradingRage
The Daily Chart
On the daily chart, the price has found support at the $56K support level. The 200-day moving average, located around the $60K area, has also been reclaimed, along with the $60K level itself.
Yet, the market is struggling to break above the $65K resistance...
Read More »
CryptoVizArt
July 16, 2024
Bitcoin (BTC), Crypto news, Markets
Bitcoin’s price demonstrates clear signs of recovery, with the market reclaiming some key levels. Investors are now hopeful that the correction phase is finally over.
Technical Analysis
By TradingRage
The Daily Chart
On the daily timeframe, the price has recently demonstrated an impulsive recovery from the $56K support level, breaking through several resistance elements. The 200-day moving average, located around the $59K mark, the bearish trendline, and the $60K resistance...
Read More »
CryptoVizArt
July 14, 2024
Bitcoin (BTC), Crypto news, Markets
Bitcoin has recently seen an uptick in demand near a crucial support level, leading to a slight rebound above the 200-day moving average at $59.2K.
This price action highlights the potential for a bullish reversal if the price stabilizes above the 200-day moving average.
Technical Analysis
By Shayan
The Daily Chart
A detailed analysis of Bitcoin’s daily chart reveals that after a prolonged bearish trend, Bitcoin broke below the 200-day moving average at $59.2K, introducing...
Read More »
George Georgiev
July 8, 2024
Bitcoin (BTC), Crypto news, Markets
Bitcoin’s recent price action has spread fear over the whole crypto market, as participants are worried that the bull market might be over.
Yet, things can change very quickly in the crypto space, and there is still a probability of recovery.
Technical Analysis
By TradingRage
The Daily Chart
On the daily timeframe, the price has been making lower highs and lows since dropping below $70K, demonstrating a clear bearish trend.
Last week, the market even broke below the key $60K...
Read More »