Just as expected, Bitcoin had produced its move. Just as we said in our recent analysis: “Unlike the crypto community on twitter, suggesting Bitcoin to K, in my opinion, the direction isn’t clear yet.”Most of the traders lose money over time. Hence, they take the wrong decisions guessing the next direction of the market. This was another classic example, as Bitcoin price broke to the bullish side following reaching the end of the 4-hour short-term triangle’s pattern.Does it mean we will see a Bitcoin’s all-time high soon? Very early to say. Bitcoin had done only a little positive step. The real ‘trouble’ is still waiting ahead, just around the corner.Total Market Cap: 2.5 billionBitcoin Market Cap: 8.3 billionBTC Dominance Index: 66.7%*Data by CoinGeckoKey Levels to Watch–
Topics:
Yuval Gov considers the following as important: BTCanalysis
This could be interesting, too:
Yuval Gov writes Bitcoin Price Analysis: BTC Struggles To Maintain Critical Support Level, Drop To 00 Very Soon?
Yuval Gov writes Bitcoin Completes 3-Day 00 Plunge: Where Is The Bottom? Price Analysis & Weekly Overview
Yuval Gov writes Bitcoin Price Analysis: After 0 Plunge In 48 Hours, Bitcoin Is Facing Huge Critical Support Area
Yuval Gov writes Bitcoin Price Analysis: Following Decent 0 Surge – Is Bitcoin Ready To Conquer ,000 Again, Or Just A Temp Correction?
Just as expected, Bitcoin had produced its move. Just as we said in our recent analysis: “Unlike the crypto community on twitter, suggesting Bitcoin to $6K, in my opinion, the direction isn’t clear yet.”
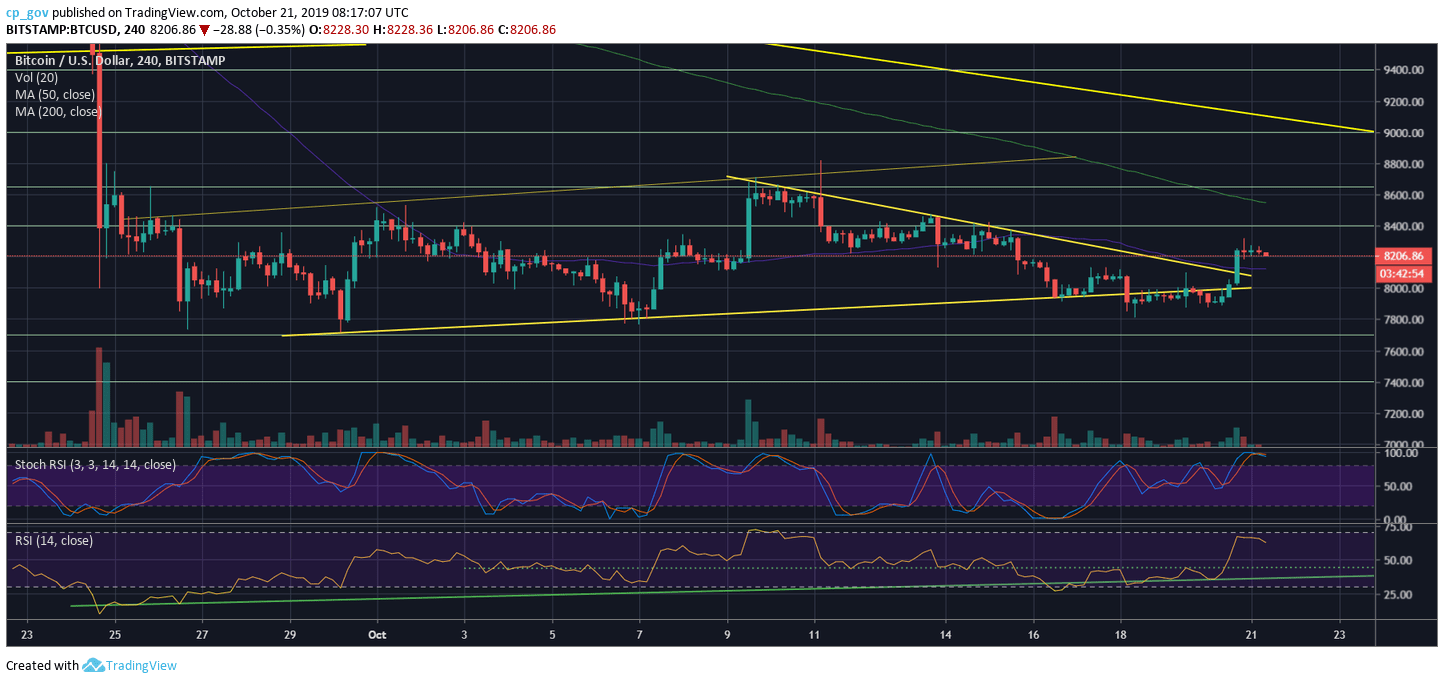
Most of the traders lose money over time. Hence, they take the wrong decisions guessing the next direction of the market. This was another classic example, as Bitcoin price broke to the bullish side following reaching the end of the 4-hour short-term triangle’s pattern.
Does it mean we will see a Bitcoin’s all-time high soon? Very early to say. Bitcoin had done only a little positive step. The real ‘trouble’ is still waiting ahead, just around the corner.
Total Market Cap: $222.5 billion
Bitcoin Market Cap: $148.3 billion
BTC Dominance Index: 66.7%
*Data by CoinGecko
Key Levels to Watch
– Support/Resistance: Following a decent $400 daily price move, Bitcoin broke out of the short-term triangle, along with the 4-hour MA-50.
After reaching the resistance at $8300, Bitcoin got rejected and currently trading around the $8200 mark for the past hours. Nothing can assure it won’t go to retest the $8000 once again, but so far, it looks promising.
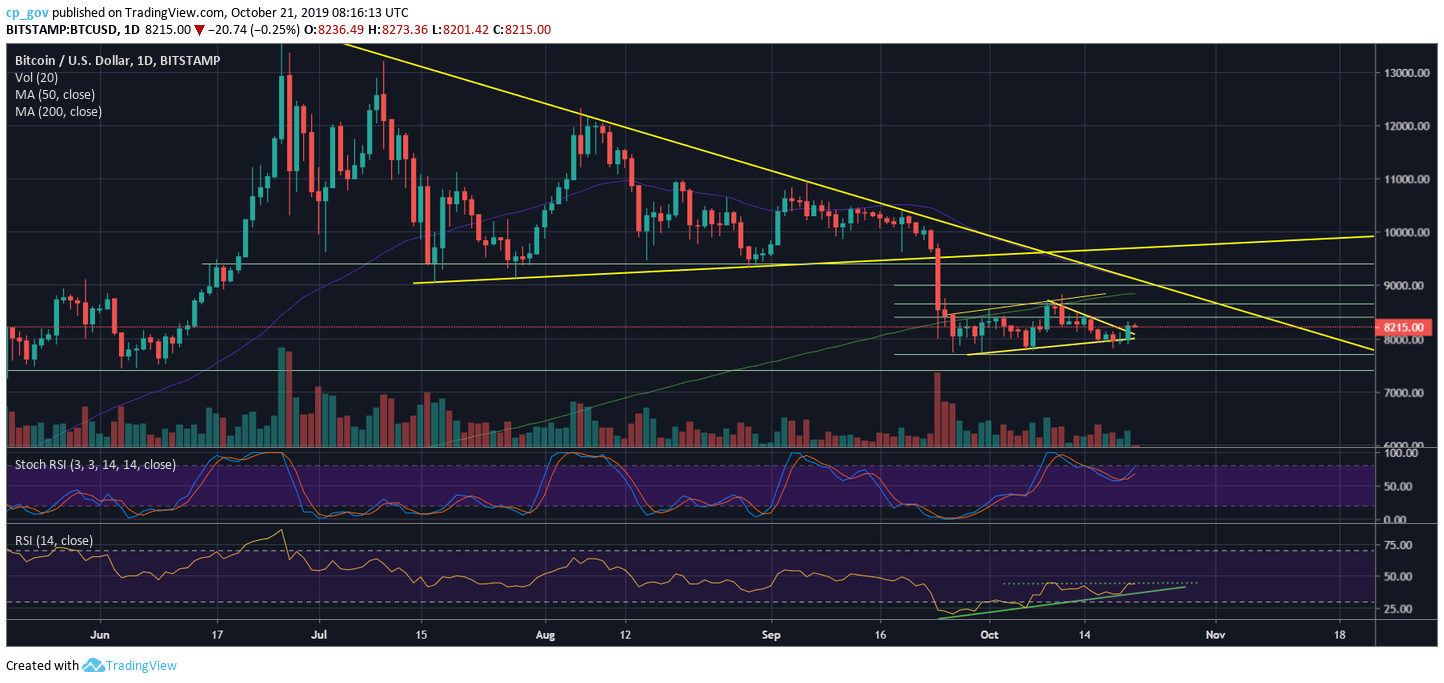
From the bullish side, Bitcoin is facing the first resistance at yesterday’s high of $8300. Slightly above is the $8400 level, before the $8650 resistance area. Then it becomes interesting: the $8800 – $9000 has a lot of seller’s waiting, this includes the significant 200-days moving average line (marked light green on the following daily chart) and the crucial descending trend-line started forming since June 26 (when Bitcoin 2019 high was captured at $13,880).
From the bearish side, after breaking it as resistance, the $8200, along with the 4-hour MA-50, are the first lines of support. Below lies the $8000 support, along with the triangle’s ascending trend-line. Further down is the $7700 – $7800 support area, which proved itself as strong shield support being tested successfully for a couple of times over the past month.
– The RSI Indicator (Daily): As stated in our previous analysis, the RSI needed to hold the higher-lows trajectory, and indeed, it did. As of now, the RSI is facing a critical level of resistance at 44. A break-up of this area could turn very bullish for Bitcoin, following the RSI forming a bullish triangle (as can be seen on the daily chart below).
– The Trading Volume: This is the only thing I really dislike here. The volume is at its lowest levels. Even the spike from yesterday couldn’t change it. For over a month, the volume amount didn’t reach real levels.


