Over the past two days and following the nice 0 price jump, Bitcoin couldn’t gain enough momentum and failed in breaking its next significant level, as stated in our previous analysis, precisely at 00.This resulted in a devastating plunge below the 00 level. Straight to our mentioned 20 level (remember this from last week’s reports?). So basically, the coin is still ‘stuck’ at the same range around the 00 mark. But now, there is another threat.A forming Head and Shoulders pattern on the 4-hour chart might, in the case it would play out, it will grant Bitcoin a target of around 00 – 00. The right shoulder’s neckline is roughly around the 00 support. The next day or two are going to be interesting in the crypto markets, in my opinion.However, there is still some hope
Topics:
Yuval Gov considers the following as important: BTCanalysis
This could be interesting, too:
Yuval Gov writes Bitcoin Price Analysis: BTC Struggles To Maintain Critical Support Level, Drop To 00 Very Soon?
Yuval Gov writes Bitcoin Completes 3-Day 00 Plunge: Where Is The Bottom? Price Analysis & Weekly Overview
Yuval Gov writes Bitcoin Price Analysis: After 0 Plunge In 48 Hours, Bitcoin Is Facing Huge Critical Support Area
Yuval Gov writes Bitcoin Price Analysis: Following Decent 0 Surge – Is Bitcoin Ready To Conquer ,000 Again, Or Just A Temp Correction?
Over the past two days and following the nice $400 price jump, Bitcoin couldn’t gain enough momentum and failed in breaking its next significant level, as stated in our previous analysis, precisely at $8400.
This resulted in a devastating plunge below the $8000 level. Straight to our mentioned $7920 level (remember this from last week’s reports?). So basically, the coin is still ‘stuck’ at the same range around the $8000 mark. But now, there is another threat.
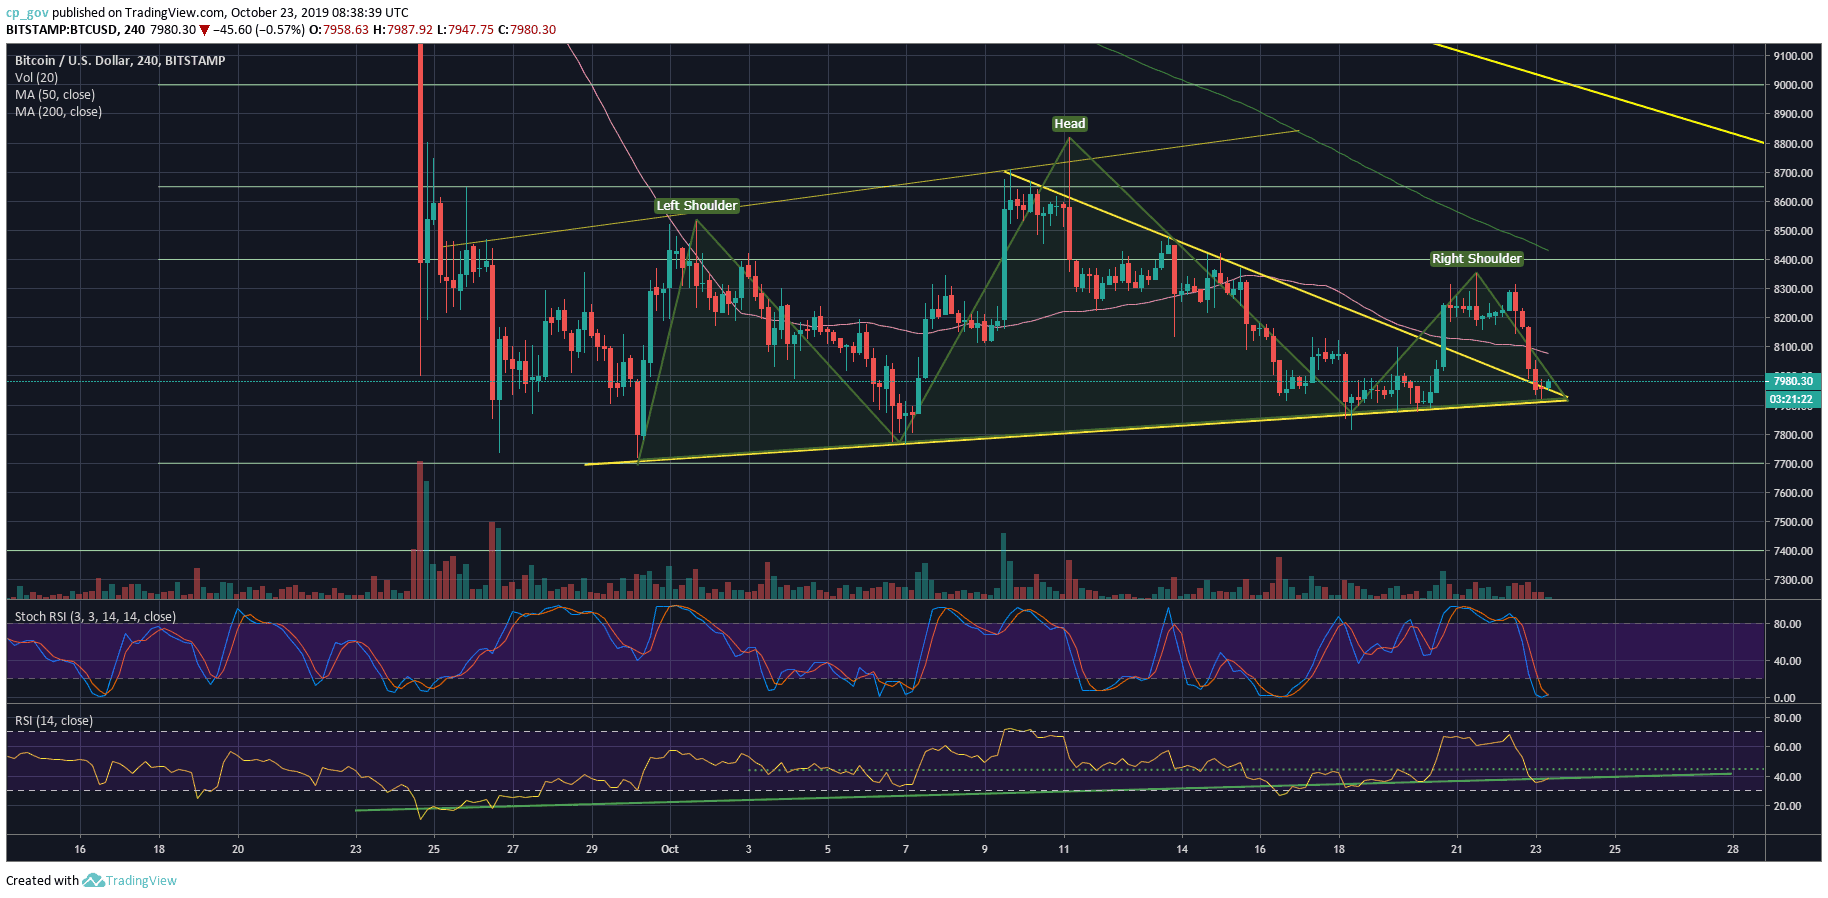
A forming Head and Shoulders pattern on the 4-hour chart might, in the case it would play out, it will grant Bitcoin a target of around $6900 – $7000. The right shoulder’s neckline is roughly around the $7900 support. The next day or two are going to be interesting in the crypto markets, in my opinion.
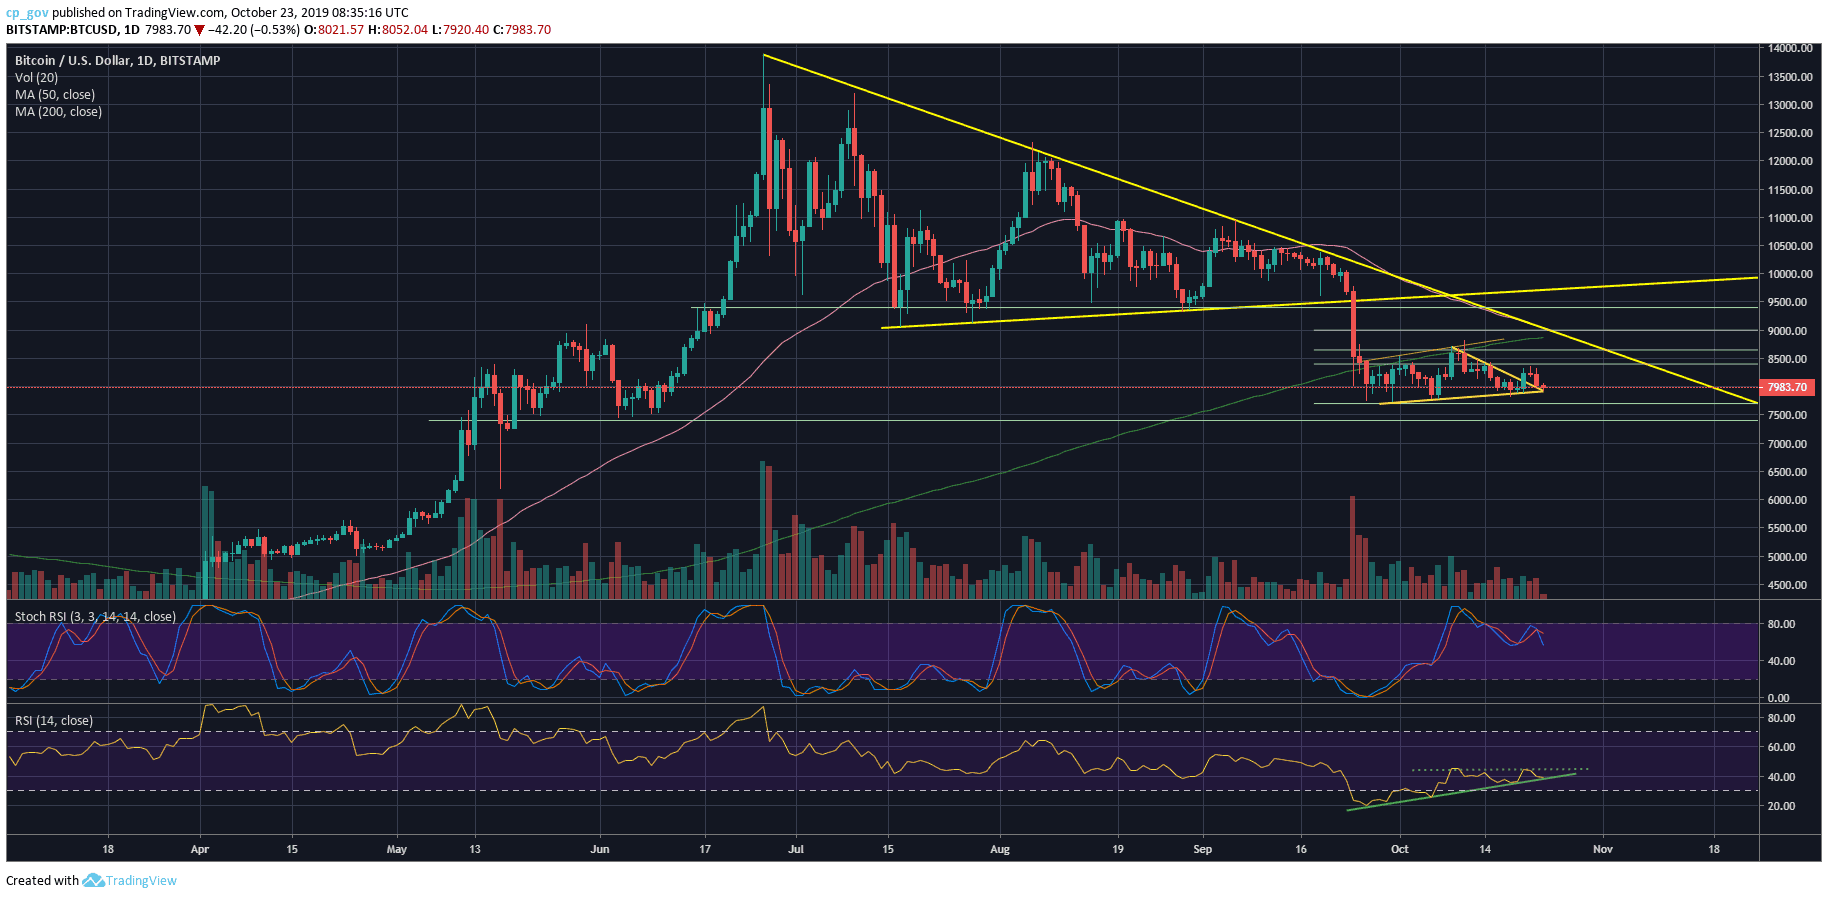
However, there is still some hope and some good news: The hope comes on behalf of the RSI. On the daily, the higher lows trajectory had been kept as of writing these lines. But, as could be seen, the RSI is currently facing a critical ascending trend-line. Fragile, but still alive.
Some good news is the recent CME Futures’ price gap that yesterday got filled when reaching down to the $8180 level. Those gaps are sometimes forming since the CME is not trading 24/7 like Bitcoin, but when they do form, it’s almost for sure that those gaps will get filled (the most famous gap of 2019 was the one from $9000 down to $8500 that got field a month ago).
Total Market Cap: $217.6 billion
Bitcoin Market Cap: $144.6 billion
BTC Dominance Index: 66.5%
*Data by CoinGecko
Key Levels to Watch
– Support/Resistance: Following the recent price action, $8000 had now become the resistance area again. Failing to sustain here, and the first level of support is the nearby $7900 area. In case of a breakdown, this could lead to a massive move to the downside (as the H&S pattern would play out). Of course, there is always the possibility of a fake-out and targets are not always get fully filled out.
Down below is the $7700 – $7800 support area, which proved itself as strong shield support being tested successfully for a couple of times over the past month. If the last gets broken down, we can expect an immediate move to $7500 and further down to $7200, which is the Golden Fibonacci historical level.
From above, Bitcoin is facing the $8000 area. In case of a break-up, then a deeper positive correction might take place. However, a lot of demand (resistance) is found at the $8000 – $8400 area. Some key levels to watch for the short-term: $8130, $8300, and of course – $8400.
– The RSI Indicator (Daily): As discussed above, the RSI is facing a critical level of support of the ascending trend-line and the 40 levels.
– The Trading Volume: On the previous analysis, following the bullish spike, I had stated: “This is the only thing I really dislike here. The volume is at its lowest levels. Even the spike from yesterday couldn’t change it.” Without buyers’ volume, the bulls can’t proceed. The volume is still at its lowest levels.
BTC/USD BitStamp 4-Hour Chart
BTC/USD BitStamp 1-Day Chart