TL;DR:Digibyte continued to gain momentum after increasing by 13% over the past day, which indicates a 3-day 60% price gains.After bouncing back from a 2-week low, DGB broke above immediate resistance and might look above for further bullish targetsDGB/USD: Digibyte Eyeing %excerpt%.0267 Resistance On Short-TermKey Resistance Levels: %excerpt%.0232, %excerpt%.0267, %excerpt%.030Key Support Levels: %excerpt%.0193, %excerpt%.017, %excerpt%.013While many altcoins saw major descending correction since Bitcoin halving took place almost two weeks ago, some are showing signs of a bounce back to their previous highs.Two days ago, Digibyte started to show strength again after experiencing a 16-day drop to %excerpt%.013 level. Following building support at around %excerpt%.017 yesterday, the price continued to increase with a sharp break above the %excerpt%.0193
Topics:
Michael Fasogbon considers the following as important: DGBBTC, DGBUSD, digibyte, Price Analysis
This could be interesting, too:
CryptoVizArt writes ETH’s Path to K Involves Maintaining This Critical Support (Ethereum Price Analysis)
Duo Nine writes Crypto Price Analysis June-29: ETH, XRP, ADA, DOGE, and DOT
Duo Nine writes Crypto Price Analysis June-15: ETH, XRP, ADA, DOGE, and DOT
Duo Nine writes Why is the Shiba Inu (SHIB) Price Down Today?
TL;DR:
- Digibyte continued to gain momentum after increasing by 13% over the past day, which indicates a 3-day 60% price gains.
- After bouncing back from a 2-week low, DGB broke above immediate resistance and might look above for further bullish targets
DGB/USD: Digibyte Eyeing $0.0267 Resistance On Short-Term
Key Resistance Levels: $0.0232, $0.0267, $0.030
Key Support Levels: $0.0193, $0.017, $0.013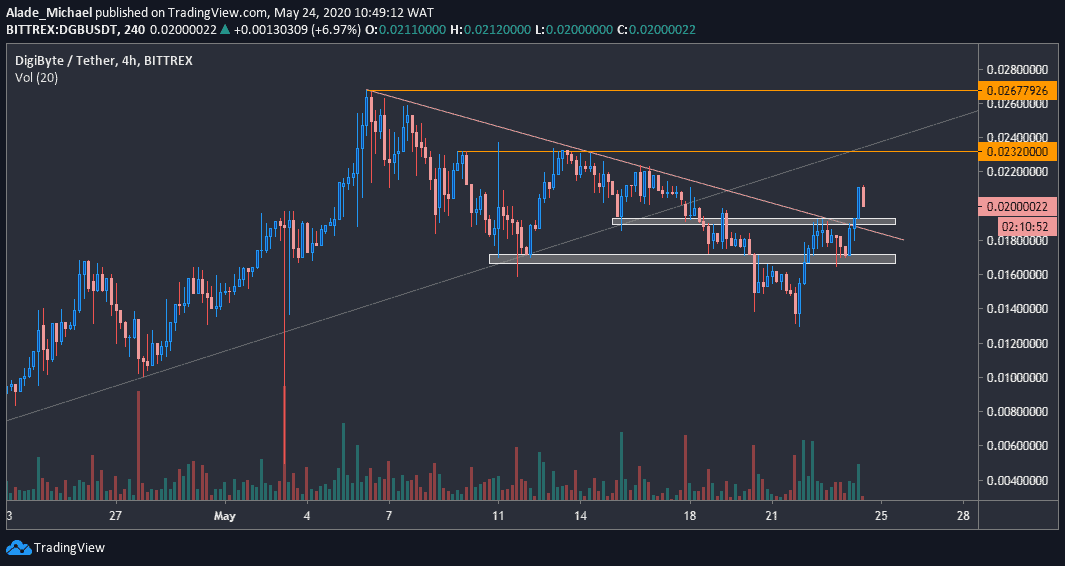
While many altcoins saw major descending correction since Bitcoin halving took place almost two weeks ago, some are showing signs of a bounce back to their previous highs.
Two days ago, Digibyte started to show strength again after experiencing a 16-day drop to $0.013 level. Following building support at around $0.017 yesterday, the price continued to increase with a sharp break above the $0.0193 resistance-turned-support today.
DGB is now trading well above the red-marked regression line, which served as dynamic resistance for the DGB/USD trading pair over the past two weeks. Looking at the 4-hours chart, Digibyte is eyeing the $0.0232 resistance.
Digibyte is now pulling back near the current break level of $0.0193 for a rebound. A bearish action may occur if this level fails to provide support.
Digibyte-USD Short-term Price Analysis
If a rebound happens, the next resistance levels to keep in mind are $0.0232 and $0.0267 (marked orange on the chart) in the next swing high. A significant increase above these resistance levels would validate a mid-term bullish momentum.
A drop below the immediate grey area of $0.0193 could generate a serious sell-off to the second grey area of $0.017 before slipping further to the $0.013 support, where DGB started to recover from just two days ago.
The trading volume is in favor of the bulls at the moment. So, the bullish action can be expected to last for a while before determining the next major direction.
DGB/BTC: Digibyte Signals Bullish Flag Breakout
Key Resistance Levels: 235 SAT, 258 SAT, 293 SAT
Key Support Levels: 209 SAT, 181 SAT, 140 SAT
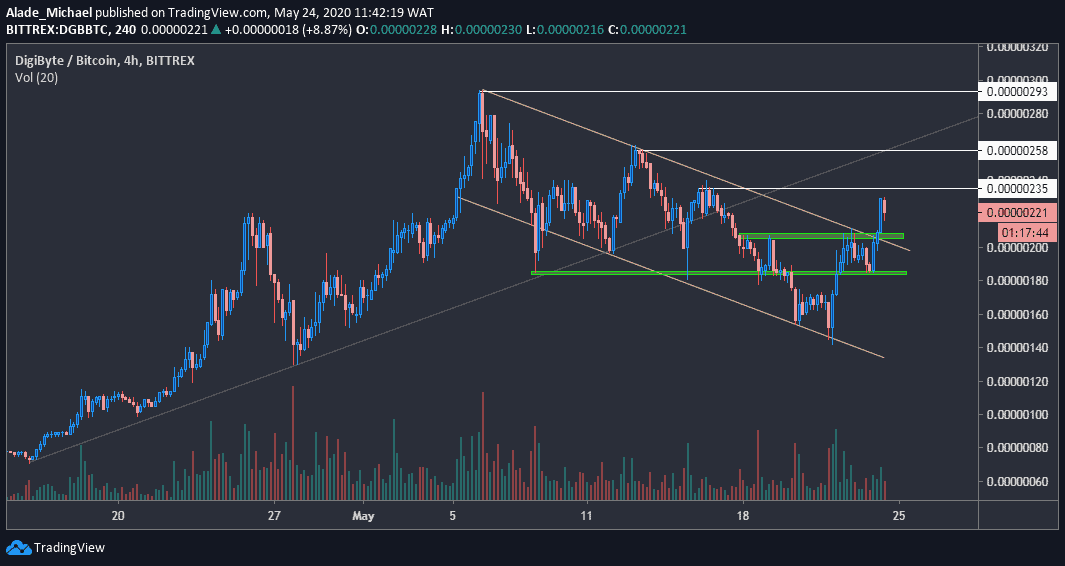
Against Bitcoin, Digibyte is maintaining a similar trend, correlated with its USD pair. The price saw a 16% increase over the last 24-hours due to a bullish regroup from 180 SAT level, now acting as temp support. DGB is currently trading near resistance at the 235 SAT level.
The recent break above a falling channel (bull-flag breakout) shows that DGB is poised for a further increase, although it may face strong resistance around the grey trend line that triggered bearish actions during last week’s trading. Digibyte would need to climb back above this trend line before confirming a nice uptrend.
As it stands now, the current rebound is still considered as a pullback to last week’s breakdown until the price fully recovers above the 300 SAT level. Nevertheless, DGB is looking bullish on the 4-hours chart, as of now.
Digibyte-BTC Short-term Price Analysis
Digibyte is now facing the 235 SAT resistance level at the moment. If the price exceeds this resistance, the next target is around the grey line at 258 SAT resistance – confluence area to watch out for a break or bounce. Above this resistance lies the 293 SAT level, all indicated in white.
In case of a pullback, the critical level to keep in mind is the 209 SAT level. DGB is expected to recover from this mentioned level. If a rebound fails, the price may roll back to where bullish action started from yesterday at 181 SAT, marked green.
Digibyte would remain trapped again in a falling channel if the price slips to 130 SAT level, where the major recover started on May 22.