Technical Analysis By GreatestTrader Ethereum’s recent forceful upswing encountered resistance upon reaching a critical price region, encompassing the K threshold and the upper boundary of an ascending wedge. This resulted in a phase of consolidation correction, retracing towards the 100 and 200-day Moving Averages (MAs). A comprehensive analysis of the daily chart exposes a notable presence of supply in the crucial K region, coinciding with the upper boundary of the multi-month wedge. The selling pressure in this pivotal resistance zone disrupted the significant upward momentum, ushering in a phase of consolidation correction within the market. Considering the significance of the K resistance and the upper boundary of the associated wedge pattern, there is a high
Topics:
CryptoVizArt considers the following as important: ETH Analysis, ETHBTC, Ethereum (ETH) Price, ethusd
This could be interesting, too:
Mandy Williams writes Ethereum Derivatives Metrics Signal Modest Downside Tail Risk Ahead: Nansen
Jordan Lyanchev writes Weekly Bitcoin, Ethereum ETF Recap: Light at the End of the Tunnel for BTC
CryptoVizArt writes Will Weak Momentum Drive ETH to .5K? (Ethereum Price Analysis)
Jordan Lyanchev writes Bybit Hack Fallout: Arthur Hayes, Samson Mow Push for Ethereum Rollback
Technical Analysis
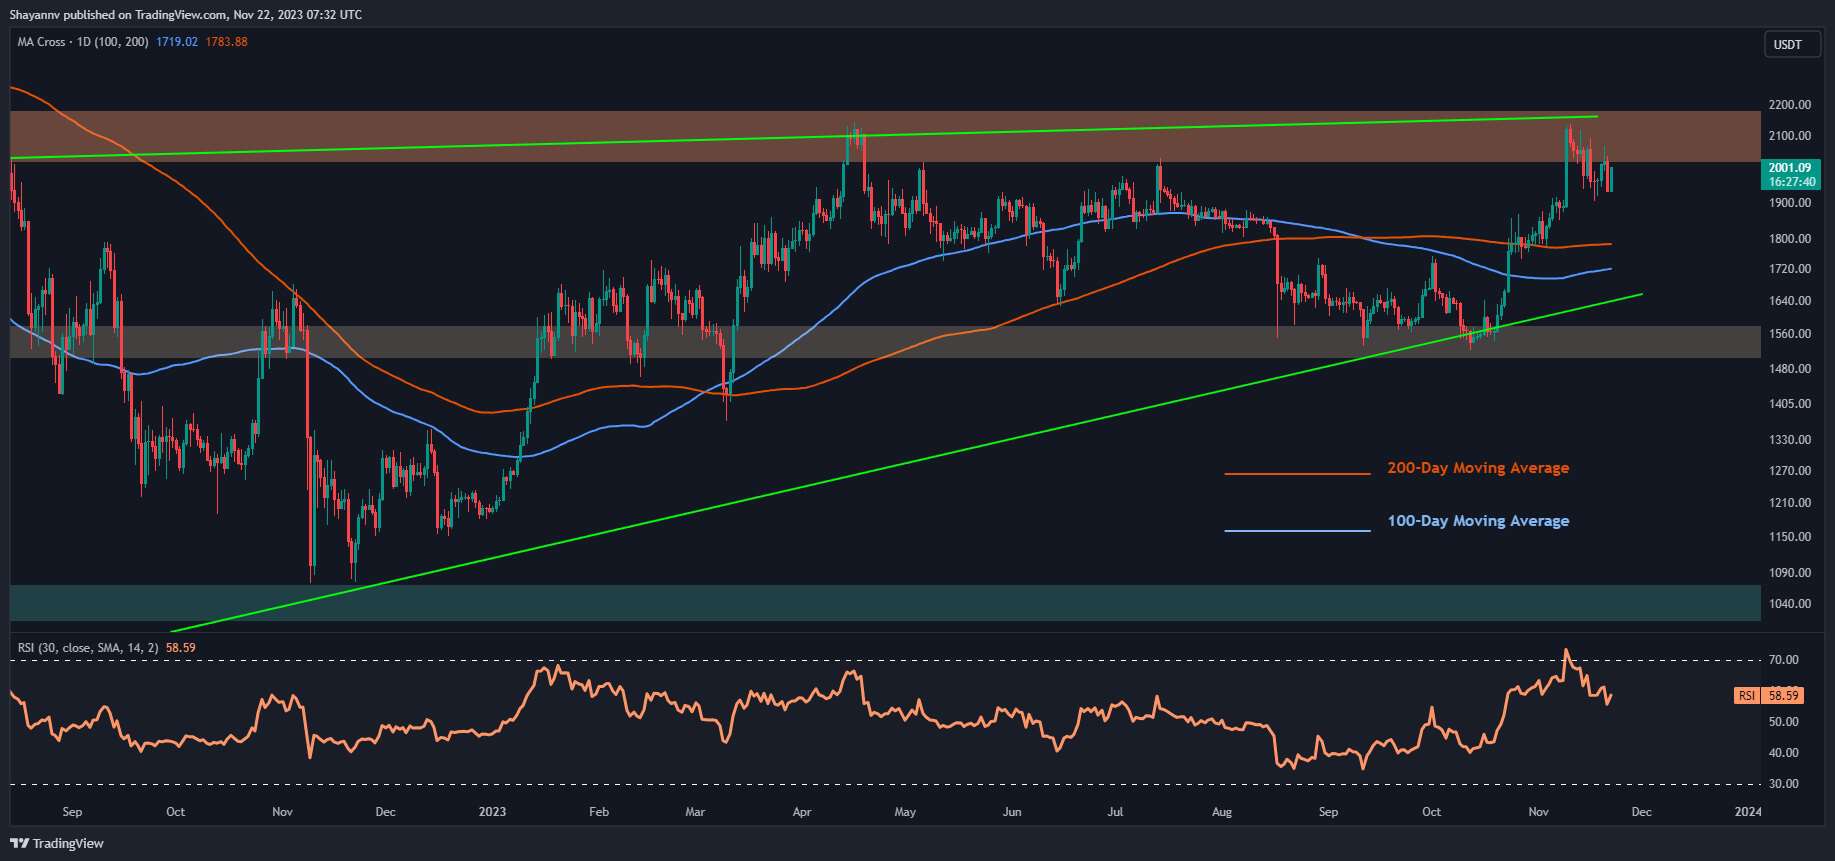
Ethereum’s recent forceful upswing encountered resistance upon reaching a critical price region, encompassing the $2K threshold and the upper boundary of an ascending wedge.
This resulted in a phase of consolidation correction, retracing towards the 100 and 200-day Moving Averages (MAs).
A comprehensive analysis of the daily chart exposes a notable presence of supply in the crucial $2K region, coinciding with the upper boundary of the multi-month wedge.
The selling pressure in this pivotal resistance zone disrupted the significant upward momentum, ushering in a phase of consolidation correction within the market.
Considering the significance of the $2K resistance and the upper boundary of the associated wedge pattern, there is a high likelihood of a temporary extension of the ongoing retracement, followed by consolidation around the breached moving averages.
If the price completes a pullback to these moving averages, it could prompt buyers to re-enter the market with the objective of once again challenging the substantial $2K level.
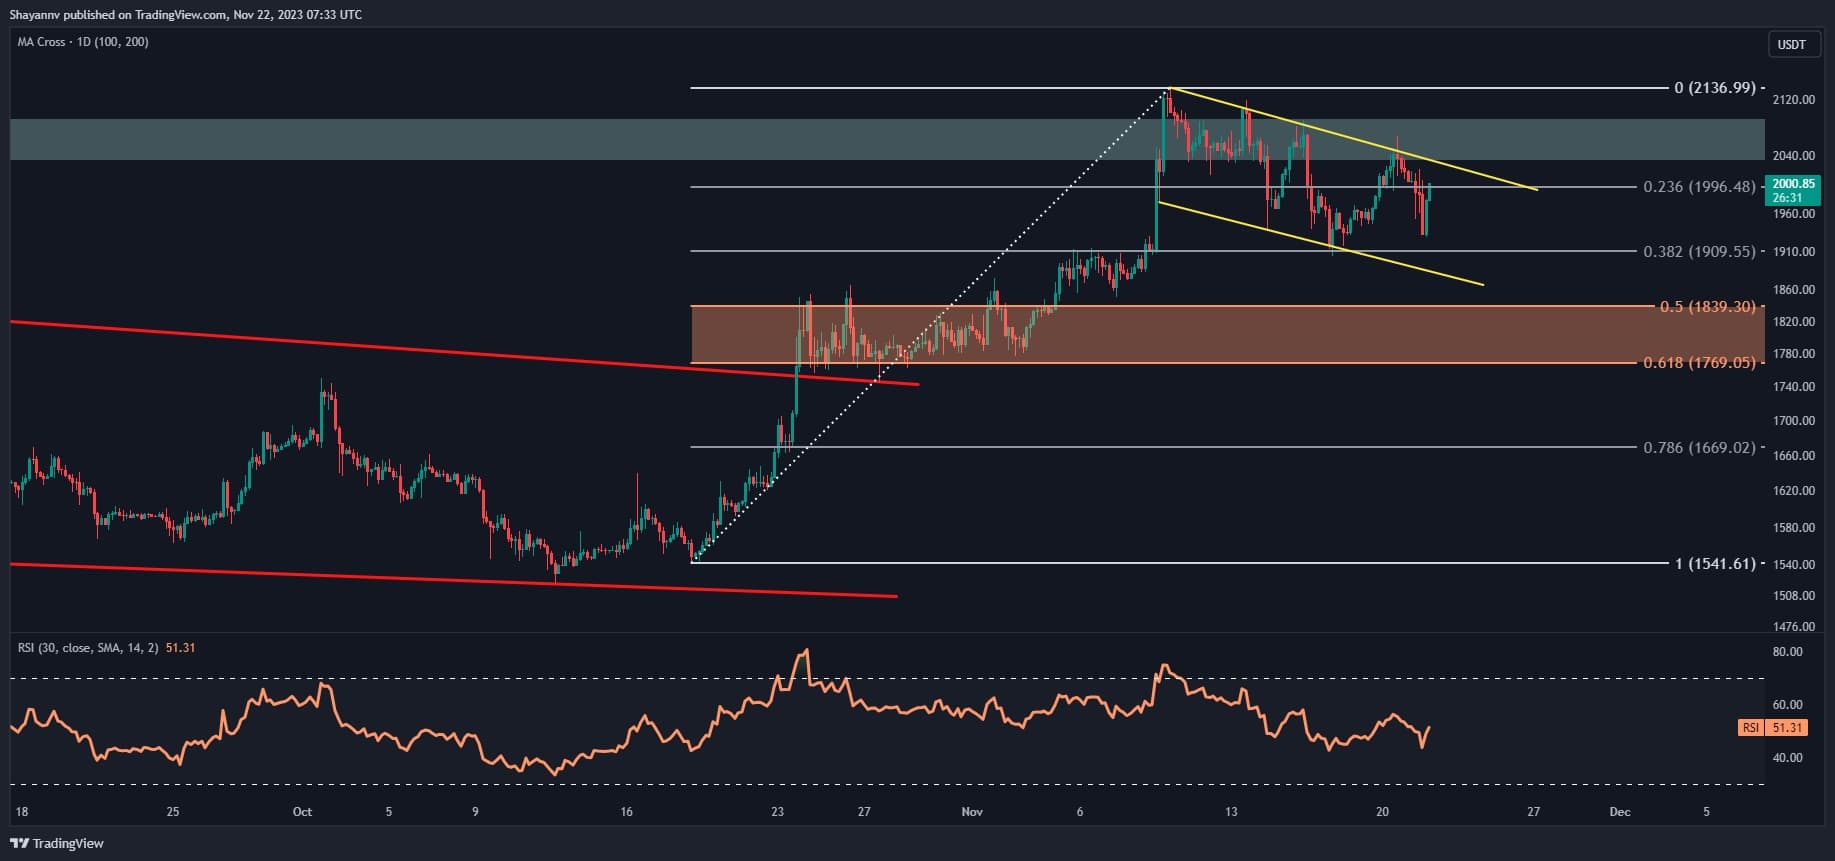
On the 4-hour chart, it is evident that Ethereum’s robust uptrend lost steam upon encountering the critical resistance at $2K. This region represents a pivotal psychological barrier, creating obstacles for buyers aiming to propel the price higher due to a notable supply presence, indicating heightened selling pressure in this key area.
Following a rejection near the $2K resistance zone, the price entered a consolidation correction phase, forming a bullish flag pattern. This well-known technical pattern implies a potential continuation of the initial uptrend, contingent on a successful breach of its upper boundary.
Given the current market dynamics, there is a considerable likelihood of an extended consolidation correction phase in the short term, targeting the support range between the 0.5 and 61.8 levels of the Fibonacci retracement ($1,839 – $1,769).
However, in the event of a sudden breakout above the flag’s upper boundary, the market could experience a substantial surge, with the objective of reclaiming the decisive $2K resistance zone.
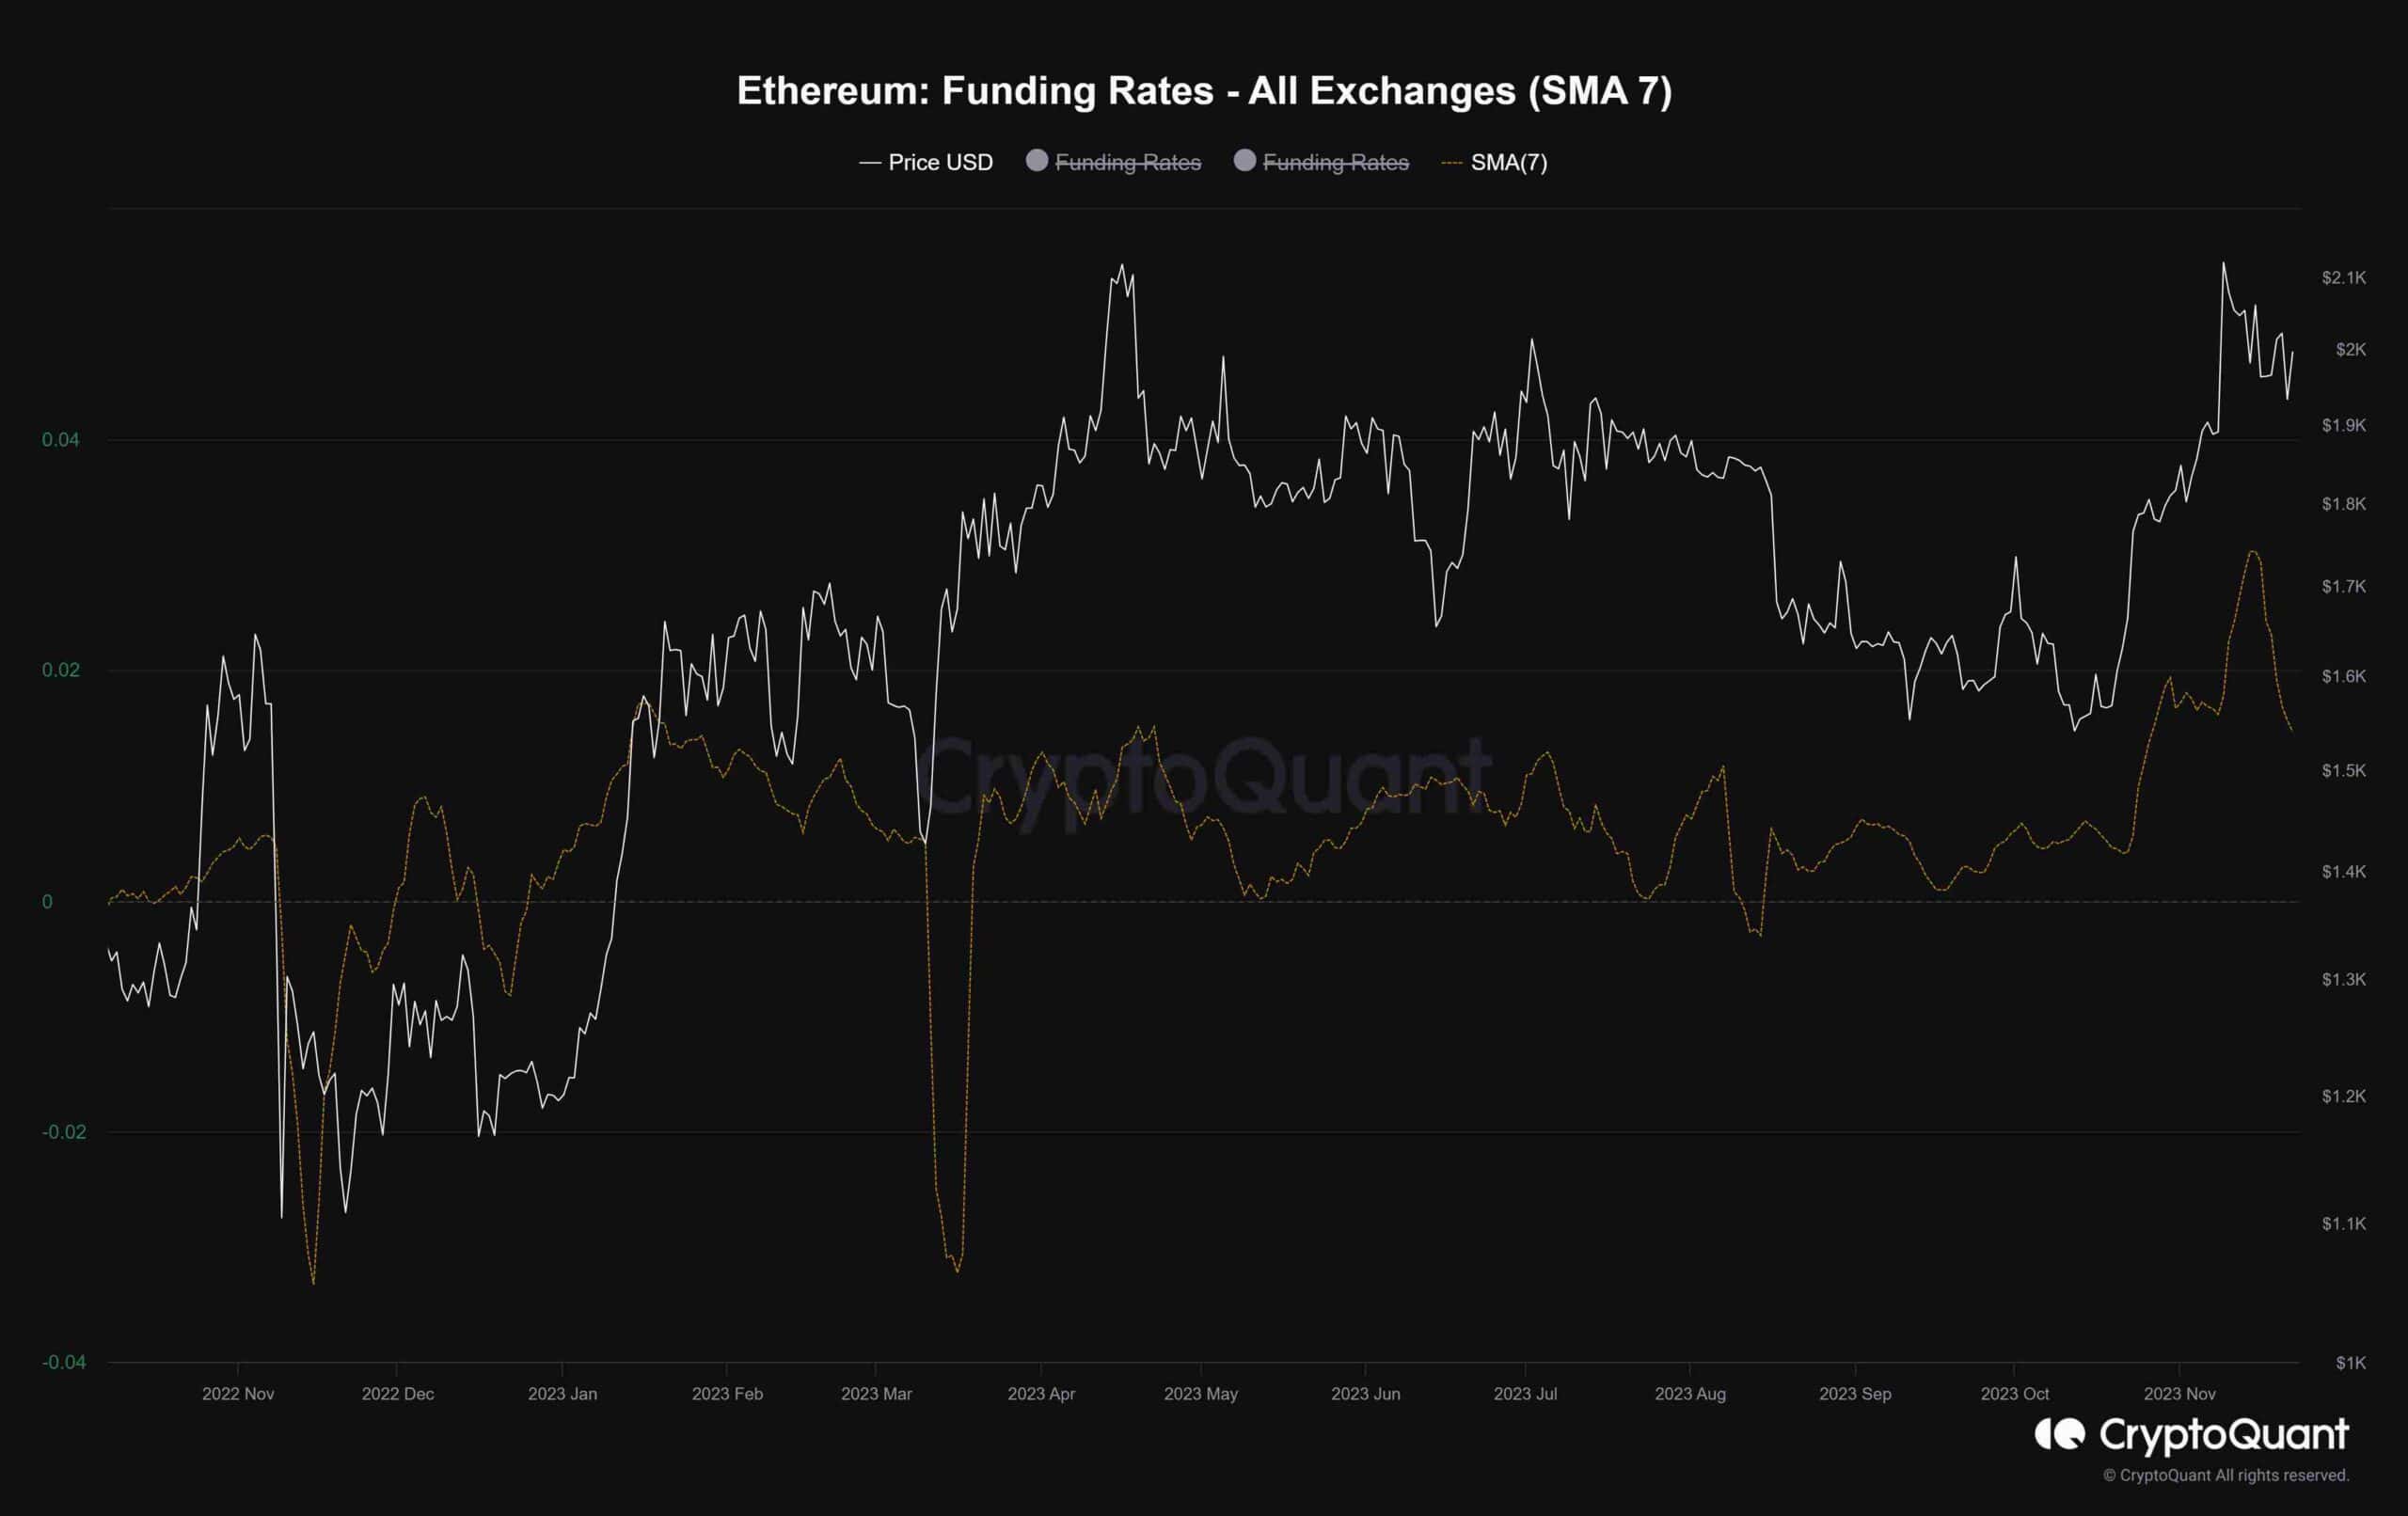
In the wake of Ethereum’s recent price surge, market participants have embraced an optimistic outlook for the medium-term future. This positive sentiment has triggered substantial buying activity across both the spot and futures markets.
The accompanying chart illustrates the funding rates, a crucial metric for gauging sentiment in the futures market. Positive values indicate a bullish sentiment, while negative values are associated with a bearish sentiment. Notably, the funding rates have consistently exhibited elevated values in recent weeks. However, a noticeable decline has emerged concurrently with a retracement in Ethereum’s price. This shift suggests a temporary pause in the futures market, poised for a potential fresh and impulsive move.
Despite this, investors should be careful, considering the recent price downturn may signify the onset of a more extensive bearish phase, potentially leading to the liquidation of a significant number of long positions.