CryptoVizArt
May 9, 2023
Bitcoin (BTC), Crypto news
Bitcoin’s price has been trending to the upside since the beginning of 2023. However, it has been showing signs of a reversal recently, following a clear rejection from the $30K resistance level.
Technical Analysis
By: Edris
The Daily Chart
The price has been consolidating since it failed to break above the $30K resistance level. The 50-day moving average has been providing support but is currently getting broken to the downside around the $28K mark.
In the event of a valid...
Read More »
CryptoVizArt
May 3, 2023
Bitcoin (BTC), Crypto news, Markets, Mining
Bitcoin’s price has been consolidating between the 50-day moving average at $28,310 and the $30K resistance region. However, it seems likely to break out of this decisive range, determining its upcoming rally’s direction.
By Shayan
The Daily Chart
After finding support at the 50-day moving average of roughly $27K, the price started a steady uptrend, aiming to surpass the $30K region for the second time. However, Bitcoin failed to surpass this crucial resistance zone,...
Read More »
CryptoVizArt
April 29, 2023
Bitcoin (BTC), Crypto news
Bitcoin has received support at the crucial 50-day moving average, located at $27,000. This has led to a rally that aims to break through the significant resistance level of $30K. Despite the cryptocurrency’s overall bullish outlook, there is potential for rejection from this price range.
Technical Analysis
By Shayan
The Daily Chart
Following a short-term correction, Bitcoin found support at the 50-day moving average, presently found at $27,300, resulting in another uptrend....
Read More »
CryptoVizArt
April 19, 2023
Bitcoin (BTC), Crypto news, Markets
Bitcoin’s price has experienced a significant surge in recent months, surpassing several resistance levels. However, the current trend seems to be losing momentum, with the cryptocurrency experiencing difficulty in claiming the crucial resistance zone of $30K.
Technical Analysis
By Shayan
The Daily Chart
The price has broken out of its narrow consolidation range near $28K and is now aggressively attempting to breach the crucial resistance level at $30K. This level holds both...
Read More »
CryptoVizArt
April 15, 2023
Bitcoin (BTC), Crypto news, Markets
Bitcoin’s price has been increasing consistently lately, continuing its bullish phase since the beginning of the year. However, the market is currently at a key resistance level, and its reaction is essential for the trend in the next few months.
Technical Analysis
By:Edris
The Daily Chart:
On the daily timeframe, the price has finally broken out of the tight consolidation range around the $28K mark, aggressively attacking the $30K resistance. This level is both a crucial...
Read More »
CryptoVizArt
April 11, 2023
Bitcoin (BTC), Crypto news, Markets
After a lengthy period of uncertainty, Bitcoin’s price has finally managed to break through a critical technical resistance level.
This has led some investors to question whether the bear market has finally come to an end or if this recent rally is just a bull trap, a temporary rise in price.
Technical Analysis
By Shayan
The Daily Chart
Bitcoin has reached a significant and decisive resistance region of $30K, bringing back the bullish sentiment in the market. Now that the...
Read More »
CryptoVizArt
April 9, 2023
Bitcoin (BTC), Crypto news
Bitcoin’s recent upward trend has ceased, and the price has entered a phase of steady consolidation with no clear direction. The cryptocurrency is currently in a crucial zone, and in order to surpass the significant obstacle of the $30K resistance level, there must be an increase in demand and buying power.
Technical Analysis
By Shayan
The Daily Chart
Bitcoin has recently reached a critical zone of $30,000, which has proven to be a significant resistance level.. This level...
Read More »
CryptoVizArt
April 4, 2023
Bitcoin (BTC)
Bitcoin’s recent uptrend has come to a standstill, with its value decreasing from a nine-month peak of $29,180 to $26,900 in the past week. Currently, the price is situated in a crucial zone, and to surpass this significant barrier posed by the $30K resistance level, greater demand and buying power must be generated.
Technical Analysis
By Shayan
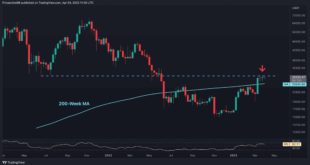
The Weekly Chart
Bitcoin’s price has recently reached a critical price zone of $30,000. The chart shows that this range is a...
Read More »
CryptoVizArt
April 1, 2023
Bitcoin (BTC), Crypto news
Bitcoin’s price has been stuck in a tight static range between $25K and $30K, consolidating without a clear direction. It must break out of this critical range to determine its future direction.
Technical Analysis
By Shayan
Daily Chart
Bitcoin’s price has formed an ascending channel on the daily timeframe and is attempting to surpass the upper trendline. However, the channel’s upper boundary roughly aligns with the major resistance region of $30K, creating a robust barrier in...
Read More »
CryptoVizArt
March 29, 2023
Bitcoin (BTC), Crypto news, Markets
Bitcoin’s price has been consolidating following the recent recovery. While the market structure has shifted bullish in the short term, there is still a key level for the price to take out to begin a new bull market.
Technical Analysis
By: Edris
The Daily Chart:
On the daily chart, it can be seen that the price has been ranging below the $30K level over the last 10 days. Yet, today’s candle is showing promising momentum to the upside, and the price could finally test the key...
Read More »