CryptoVizArt
June 24, 2023
Bitcoin (BTC), Crypto news, Markets
After an extended period of consolidation, Bitcoin’s price has successfully surpassed the critical $30K resistance level. However, it is important to exercise caution within the market, particularly in the short term.
Technical Analysis
By: Edris
The Daily Chart
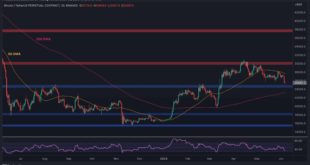
On the daily timeframe, Bitcoin’s price has experienced a rapid upward movement in the past week, following a strong bounce from the $25K support level. The resistance at $30K has been exceeded, and the price is...
Read More »
CryptoVizArt
June 14, 2023
Bitcoin (BTC), Crypto news
The Bitcoin price remains in a consolidation phase below the $30K resistance level following its unsuccessful attempt to break above it a few weeks ago. Nonetheless, several nearby support levels have the potential to act as catalysts for a possible bounce.
Bitcoin Price Technical Analysis
By: Edris
The Daily Chart:
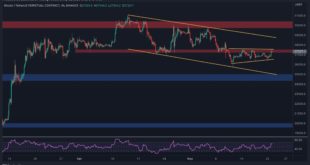
On the 4-hour chart, the price is still trapped inside the large descending channel and is on a slow downtrend, making lower highs and lows. Currently, the $26K...
Read More »
CryptoVizArt
June 7, 2023
Bitcoin (BTC), Crypto news
The price of Bitcoin is currently on a downward trajectory since it faced resistance at $30K in April. However, there are notable support levels that may prevent further decline.
Technical Analysis
By: Edris
The Daily Chart:
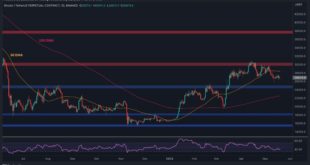
On the daily timeframe, the Bitcoin price has consistently formed lower highs and lows in the past couple of months. The 50-day moving average acted as a strong resistance, causing a downward rejection near the $28K level.
Following yesterday’s rebound,...
Read More »
CryptoVizArt
June 4, 2023
Bitcoin (BTC), Crypto news
Bitcoin’s price is currently going through a phase of consolidation and has reached the 100-day moving average of $26,922. However, two significant support areas ahead on its path could potentially halt the ongoing decline and trigger the next bullish rally.
Technical Analysis
By Shayan
The Daily Chart
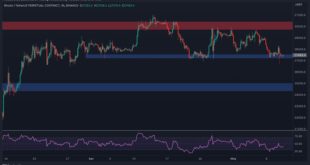
During the consolidation correction stage, BTC dipped slightly below the middle trendline of the ascending channel and tested it as a pullback. However, the Bitcoin price...
Read More »
CryptoVizArt
May 27, 2023
Bitcoin (BTC), Crypto news, Markets
Over the past few weeks, Bitcoin’s price has been consolidating within a narrow range after breaking below the 50-day moving average. The market is currently situated between two notable levels, leaving room for several potential scenarios to unfold.
Technical Analysis
By: Edris
The Daily Chart:
The price on the daily timeframe has yet to display a notable upward or downward movement. If a rally takes place in the upcoming weeks, the first resistance level to watch is the...
Read More »
CryptoVizArt
May 23, 2023
Bitcoin (BTC), Crypto news, Markets
For the past two weeks, Bitcoin has maintained its range-bound price movement. However, there are several indicators pointing toward an imminent breakout.
Technical Analysis
By Edris
The Daily Chart
The price has been consolidating within a narrow range on the daily timeframe for the last 7 days. This consolidation follows the market’s downward rejection at the $30K resistance level and the subsequent breakdown of the 50-day moving average of around $29K.
Currently, the...
Read More »
CryptoVizArt
May 20, 2023
Bitcoin (BTC), Crypto news, Markets
Bitcoin has been stuck in a range in the last few days following a rejection from the $30K resistance level. There are various points for market participants to look forward to in the short term.
Technical Analysis
By: Edris
The Daily Chart
On the daily timeframe, the price has been consolidating in a very tight range over the last week. This comes after the $30K resistance level rejected the market to the downside. The 50-day moving average was also broken down around the...
Read More »
CryptoVizArt
May 18, 2023
Bitcoin (BTC), Crypto news
Bitcoin’s price has continued trending downward for several weeks, making lower highs and lows. Even so, hope remains that the potential for a bullish rally is not yet over.
Technical Analysis
By: Edris
The Daily Chart
On the daily chart, the price has been dropping recently after failing to break through the key $30K resistance level. The 50-day moving average, located around the $28K mark, has also been broken to the downside and would act as resistance until the price...
Read More »
CryptoVizArt
May 14, 2023
Bitcoin (BTC), Crypto news, Markets
Bitcoin’s price has been dropping continuously over the last week, and there may still be more. However, the bearish momentum is much lower than expected, and multiple support levels are available for the market to rely on.
Technical Analysis
By: Edris
The Daily Chart
Looking at the daily timeframe, the price has been declining since getting rejected from the $30K resistance level in April, and it has also broken below the 50-day moving average, located around the $29K mark....
Read More »
CryptoVizArt
May 11, 2023
Bitcoin (BTC), Crypto news
Bitcoin has been showing relatively bearish price action after a decisive rejection from the $30K resistance level, while also losing key support recently. Yet, there are still multiple crucial zones for the price to rely on.
Technical Analysis
By: Edris
The Daily Chart
The price has been consolidating below the $30K resistance level following a failed breakout earlier in April. The 50-day moving average has also been broken to the downside around the $28K mark as a result of...
Read More »