CryptoVizArt
September 16, 2023
Bitcoin (BTC), Crypto news, Markets
Bitcoin’s price has been consolidating above the $25K support level following the recent drop from the key $30K zone.
However, for the price to reach a new high and break past $30K, there is still much work to do.
Technical Analysis
By Edris
The Daily Chart
On the daily chart, the price has been rejected from the $25K support level and is trending higher. Yet, the 50-day and 200-day moving averages around the $28K mark are two significant resistance levels that the market...
Read More »
CryptoVizArt
September 9, 2023
Bitcoin (BTC), Crypto news, Markets
After experiencing a significant downward move that brought Bitcoin’s price quickly close to the $25K threshold, bearish momentum has temporarily subsided, giving way to a phase of consolidation marked by low volatility.
Despite this, the most likely scenario for Bitcoin appears to be a period of sideways movement followed by a temporary retracement towards the 100-day and 200-day moving averages (MAs).
Technical Analysis
By Shayan
The Daily Chart
The recent wave of intense...
Read More »
CryptoVizArt
September 5, 2023
Bitcoin (BTC), Crypto news
Bitcoin has been following a bearish price action over the last few weeks following the rejection from the critical $30K resistance level. Yet, there is still hope to recover.
Technical Analysis
By Edris
The Daily Chart
The price has dropped significantly from the $30K resistance zone on the daily timeframe, breaking below both the 50-day and 200-day moving averages. The $25K support level is currently holding it.
Yet, the 200-day moving average, located around the $28K mark,...
Read More »
CryptoVizArt
September 2, 2023
Bitcoin (BTC), Crypto news
Bitcoin experienced an unanticipated decline from the $29K mark, leading to a substantial breakdown of the pivotal 100-day and 200-day moving averages. Following the bearish trend, how low can BTC go?
Technical Analysis
By Shayan
The Daily Chart
After plummeting from the $29K threshold, Bitcoin’s price dropped below the critical 100-day and 200-day moving averages, finding support amid the significant $25K level, where a bounce was initiated.
This sudden upward surge was a...
Read More »
CryptoVizArt
August 30, 2023
Bitcoin (BTC), Crypto news
Bitcoin’s price surged yesterday, bouncing from a critical support level. The surge came following the Grayscale news. However, a bearish continuation is still possible if the price remains below the 200-day moving average.
Technical Analysis
By Edris
The Daily Chart
On the daily chart, the price has finally demonstrated some bullish price action after finding support at the $25K level. The 200-day moving average, located around the $27,500 mark, is currently being tested.
A...
Read More »
CryptoVizArt
August 27, 2023
Bitcoin (BTC), Crypto news
Bitcoin’s price shows a very low intent to recover following the recent drop last week. Things are not looking positive in the short term.
Technical Analysis
By Edris
The Daily Chart
On the daily chart, the price has been consolidating inside a tight range over the last few days, following a massive drop from the $30K critical resistance zone. The 200-day moving average has also been broken to the downside, which is a clear bearish trend signal.
Yet, considering the oversold...
Read More »
CryptoVizArt
August 23, 2023
Bitcoin (BTC), Crypto news, Markets
Bitcoin’s price has recently crashed, losing nearly $5,000 in one day.
The following analysis looks at the details behind the crash and how it affects the overall market’s trend.
Technical Analysis
By Edris
The Daily Chart
On the daily timeframe, the price has been rejected from the $30K resistance level multiple times in recent months.
The last rejection from this level and the 50-day moving average near the same price have initiated a significant drop to the downside. BTC...
Read More »
CryptoVizArt
August 19, 2023
Bitcoin (BTC), Crypto news, Markets
After a prolonged period of silence near the critical $30K threshold, the price has encountered significant rejection, resulting in a swift and rapid decline.
However, the current scenario shows the price consolidating close to the crucial support range of $25K, where it could potentially find a bottom and halt further downtrends.
Technical Analysis
By Shayan
The Daily Chart
Following a minor corrective phase, where a bearish divergence occurred between the price and the RSI...
Read More »
CryptoVizArt
August 14, 2023
Bitcoin (BTC), Crypto news
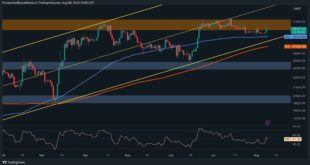
Bitcoin’s price movement has remained stagnant after being rejected from the critical resistance zone at $30,000. However, it is currently consolidating near a pivotal support area, which includes both the 100-day moving average and the lower boundary of a multi-month ascending channel.
Technical Analysis
By Shayan
The Daily Chart
The daily chart analysis shows that the price entered a slight corrective phase at the beginning of July, marked by diminished volatility and...
Read More »
CryptoVizArt
August 9, 2023
Bitcoin (BTC), Crypto news, Markets
A prolonged struggle has been ongoing between buyers and sellers centered around the 100-day moving average.
The price has been exhibiting remarkably low volatility, which suggests a state of indecision in the market. The price action within this pivotal price range could potentially indicate Bitcoin’s future price movement.
Technical Analysis
By Shayan
The Daily Chart
The daily chart depicts a corrective movement following the rejection at $30K. This movement is...
Read More »