CryptoVizArt
March 26, 2023
Bitcoin (BTC), Crypto news
After reaching the critical price area of $29-30K, Bitcoin’s bullish rally got rejected, and the price went back into the $27-28K consolidation range.
Over the next short-term, the $30K mark will likely serve as the most major resistance. This range was the bottom recorded in mid-2021 before the rally to the current Bitcoin’s ATH at $69K recorded in November 2021.
Technical Analysis
By Shayan
The Daily Chart
After forming a pullback to the 100-day moving average line at...
Read More »
CryptoVizArt
March 23, 2023
Bitcoin (BTC), Crypto news, Markets
Bitcoin’s impulsive rally seems to have temporarily halted, and the price will likely enter a correction phase before the next leg up. Overall, Bitcoin is facing significant resistance at the $30K level, which hasn’t been tested yet.
Technical Analysis
By Shayan
The Daily Chart
After forming a pullback to the 61.8% level of the Fibonacci entrancement level at $19.6K, the price initiated a massive rally with a current high above $28K. However, the bulls couldn’t reach the...
Read More »
CryptoVizArt
March 20, 2023
Bitcoin (BTC), Crypto news, Markets
Bitcoin’s price rallies after breaking above a significant resistance level. However, the 2022 bear market is not over yet until another critical level is broken to the upside.
Technical Analysis
By: Edris
The Daily Chart
On the daily chart, Bitcoin’s price had seen a massive uptrend over the past week, following a V-shaped rebound from the 200-day moving average located amid the $20K mark, followed by a decent breakout above the $25K resistance level.
Currently, the price is...
Read More »
CryptoVizArt
March 14, 2023
Bitcoin (BTC), Crypto news, Markets
Bitcoin’s price has surged over the last couple of days and has broken past a key resistance level. While the momentum is highly bullish, there are some caution signals to look out for.
Technical Analysis
By: Edris
The Daily Chart:
On the daily chart, the price has rebounded decisively from the significant 200-day moving average, located around the $20K mark a few days ago. Since then, the market has been trending impulsively to the upside, finally breaking above the $25K...
Read More »
CryptoVizArt
March 11, 2023
Bitcoin (BTC), Crypto news, Markets
The instability of Circle’s USDC has caused extreme fear in the market, as stablecoins play a crucial role in the cryptocurrency industry. Bitcoin’s price was affected by the recent turmoil and has declined, but it faces a strong support level.
By Shayan
The Daily Chart
Recently, the price of Bitcoin experienced a downtrend with noticeable bearish momentum after forming a reversal three-drives pattern and breaking down the neckline. The recent turmoil with USDC served as a...
Read More »
CryptoVizArt
March 8, 2023
Bitcoin (BTC), Crypto news, Markets
After forming a bearish three-drives reversal pattern, the price has recently dropped below the neckline, delivering a significantly bearish signal for the short-term outlook. As of now, BTC faces an important support region at $21K.
Technical Analysis
By Shayan
The Daily Chart
As expected, the three-drives pattern resulted in a trend reversal and a decline in the price. Bitcoin was recently rejected below the neckline and is consolidating with very little momentum.
However,...
Read More »
CryptoVizArt
March 1, 2023
Bitcoin (BTC), Crypto news
Bitcoin’s price has been consolidating below a significant resistance level in recent weeks after continually failing to break it to the upside. While there is still a high probability for the price to break above this crucial point, multiple support levels are also available if a pullback were to occur.
Technical Analysis
By: Edris
The Daily Chart
On the daily chart, the price has been rejected from the key $25K resistance level multiple times recently. Currently, the 50-day...
Read More »
CryptoVizArt
February 25, 2023
Bitcoin (BTC), Crypto news
Bitcoin’s price has been struggling to break above a significant resistance level and is currently experiencing a pullback, following the recent red days on Wall Street. Is it just a short-term correction or a beginning of a new bearish leg?
Technical Analysis
By: Edris
The Daily Chart
On the daily timeframe, the price dropped shortly after getting rejected from the critical $25K level. The 50-day moving average around the $22K level would be the first likely support level,...
Read More »
CryptoVizArt
February 19, 2023
Bitcoin (BTC), Crypto news, Markets
Bitcoin’s recent price spikes underline the demand and confidence in the crypto market. This resulted in a significant surge in many cryptocurrencies. However, the price still faces a critical resistance level of $25K before calling the bear market over.
Technical Analysis
By Shayan
The Weekly Chart
Looking at a bigger picture of Bitcoin’s price using the weekly timeframe, the price action looks similar to the final capitulation stage of the 2018 bear market. During the final...
Read More »
CryptoVizArt
February 16, 2023
Bitcoin (BTC), Crypto news, Markets
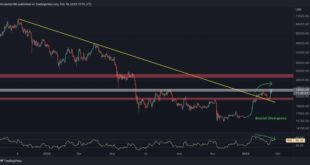
Bitcoin’s price exploded following a consolidation and pullback phase. It is currently testing a key resistance level, and its reaction will likely determine the short-term future of the market.
Technical Analysis
By: Edris
The Daily Chart
On the daily timeframe, the price is retesting the $25K resistance level once again after a rejection and bearish pullback several weeks ago. Considering the last day’s candle, bullish momentum seems very high at the moment, and a breakout...
Read More »