CryptoVizArt
January 7, 2023
Bitcoin (BTC), Crypto news, Markets
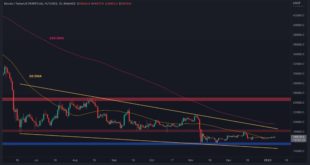
Bitcoin’s price has broken above a significant moving average which has been acting as a resistance over recent weeks. The market seems ready to rise higher in the coming week if the remaining negative factors do not hinder the forming momentum.
Technical Analysis
By: Edris
The Daily Chart:
On the daily timeframe, the price has closed above the 50-day moving average to the upside at last, after failing to do so and getting rejected multiple times over the last few weeks.
This...
Read More »
CryptoVizArt
January 4, 2023
Bitcoin (BTC), Crypto news, Markets
As we head into 2023, the markets are beginning to show some interesting movements, and Bitcoin is no exception. Its price is currently testing a key resistance zone, and the outcome would likely determine the short-term trend for the crypto market.
Technical Analysis
By: Edris
The Daily Chart
On the daily timeframe, the price seems to be closing in on finally disrupting the consolidation of the last few weeks, as the 50-day moving average is being tested once more around the...
Read More »
CryptoVizArt
January 3, 2023
Bitcoin (BTC), Crypto news, Markets
The market is currently suffering from insufficient activity and liquidity. Meanwhile, Bitcoin’s price is up against a crucial resistance zone and is about to break out. The move should determine the upcoming direction and end the current close-to-neutral state between selling and buying pressure in the market.
Technical Analysis
By Shayan
The Daily Chart
After getting rejected by the 50-day moving average and consolidating for a few days, the price finally tested the blue...
Read More »
CryptoVizArt
December 30, 2022
Bitcoin (BTC), Crypto news
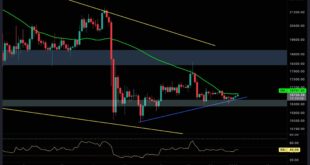
Bitcoin’s price has been confided by a very tight price range between the 50-day moving average and the ascending trendline. Considering the importance of this price range, the breakout’s direction should determine the mid-term perspective of the cryptocurrency’s path.
Technical Analysis
By Shayan
The Daily Chart
Bitcoin’s price started recovering after the significant crash toward $15K in mid-November. However, the rally didn’t last long and was halted at the $18K resistance...
Read More »
CryptoVizArt
December 28, 2022
Bitcoin (BTC), Crypto news, Markets
Bitcoin’s price has been oscillating in a very tight range heading into the new year’s holidays, offering little clue on the direction of the next significant move. Nevertheless, the market remains in a very decisive area, and its fate could be revealed in the next few days.
Technical Analysis
By: Edris
The Daily Chart
On the daily chart, the price has been grappling with the 50-day moving average around the $16,700 mark for a while now but is yet to break it in any...
Read More »
CryptoVizArt
December 25, 2022
Bitcoin (BTC), Crypto news
Bitcoin continues to print minor daily fluctuations as the price consolidates inside a tight range with low volatility. Currently, the price is testing a significant resistance area, and in case a rejection takes place – BTC is likely to retest lower-price areas. On the other hand, a breakout could lead to a mini-rally.
Technical Analysis
By Shayan
The Daily Chart
Bitcoin has failed to sustain above the 50-day and 100-day moving averages over the last few months. Most...
Read More »
CryptoVizArt
December 22, 2022
Bitcoin (BTC), Crypto news, Markets
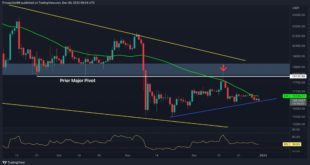
Bitcoin is grappling with a crucial resistance level at roughly $17K, which also aligns with the 100-day moving average. A breakout from here will potentially initiate an uptrend in the short term.
Technical Analysis
By Shayan
The Daily Chart
The price has been trapped inside a descending wedge pattern for several months and is consolidating with significantly lower volatility. Meanwhile, the 100-day moving average has served as a powerful barrier at around $17K.
The current...
Read More »
CryptoVizArt
December 20, 2022
Bitcoin (BTC), Crypto news, Markets
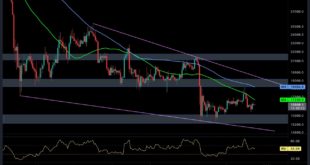
Bitcoin’s price continues to consolidate in a tight range, as it failed to break a significant resistance level to the upside a few days ago. However, from a technical analysis standpoint, the time for a decisive breakout is near.
Technical Analysis
By: Edris
The Daily Chart
On the daily chart, the price is still consolidating in a large falling wedge pattern. These are commonly known as potential bullish reversal patterns in a bear market, provided they get broken to the...
Read More »
CryptoVizArt
December 18, 2022
Bitcoin (BTC), Crypto news
The overall Bitcoin price action is on an impulsive decline after experiencing a significant rejection from a long-lasting resistance level at $18k. Failing the support level at $15k, the bulls could be in for a lot of trouble soon.
Technical Analysis
By: Edris
The Daily Chart:
Looking at the daily chart, the price oscillates in the large falling wedge pattern. While this is usually a reversal pattern in a downtrend if broken to the upside, the price has failed to reach the...
Read More »
CryptoVizArt
December 14, 2022
Bitcoin (BTC), Crypto news
This week’s CPI announcement was a significant relief for Bitcoin investors, as declining inflation would likely lead to a bullish trend for risk assets. However, there is still room for caution from a technical analysis standpoint, as the price has yet to break any major resistance level.
Technical Analysis
By: Edris
The Daily Chart
On the daily timeframe, the price has finally reached the $18K resistance area and is currently trying to break it to the upside. The 50-day...
Read More »