CryptoVizArt
December 11, 2022
Bitcoin (BTC), Crypto news
Bitcoin is fighting to get over two crucial resistance levels. A successful breakout above these vital barriers could potentially result in a bullish surge in the near future.
Technical Analysis
By Shayan
The Daily Chart
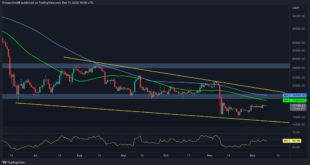
After touching the lower trendline of the descending wedge pattern, the price of bitcoin initiated a mini-rally followed by extremely low momentum and trading volume. The price now faces two substantial resistance levels: the 50-day moving average at $17.9K...
Read More »
CryptoVizArt
December 9, 2022
Bitcoin (BTC), Crypto news, Markets
Bitcoin’s price is approaching a key resistance area as the markets are patiently waiting for the CPI release next week. Both the chart and the high probability of another decline showing in the inflation readings are suggesting that a turning point for Bitcoin may be near.
Technical Analysis
By: Edris
The Daily Chart
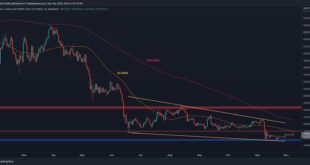
On the daily chart, the price is still trapped in a large descending channel and has yet to break it to either side. This pattern is typically an early sign of...
Read More »
CryptoVizArt
December 5, 2022
Bitcoin (BTC), Crypto news
Following a massive decline in early November, Bitcoin’s price has consequently suffered from extremely low volatility. The cryptocurrency has been consolidating with serious downward momentum since this significant drop.
Technical Analysis
By Shayan
The Daily Chart
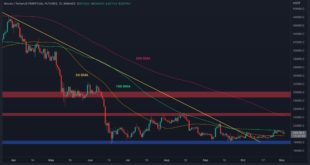
After falling below both the yellow trendline and the significant support level of $18K, the price is seeing very low volatility on the daily chart. A pullback to the trendline and the broken level is necessary...
Read More »
CryptoVizArt
December 4, 2022
Bitcoin (BTC), Crypto news, Markets
Bitcoin’s price is approaching a significant level, which could prove decisive for the mid-term trend of the market. Although there are some positive signs on the technical charts, it remains too early to decide whether a new bullish phase is on the horizon.
Technical Analysis
By: Edris
The Daily Chart:
On the daily chart, Bitcoin’s price has been forming a large falling wedge over the last few months. The price has recently bounced back from the lower boundary of the pattern...
Read More »
CryptoVizArt
November 26, 2022
Bitcoin (BTC), Crypto news, Markets
Bitcoin’s price action has rebounded significantly while testing key support levels. The next few days could determine whether the market would start a mid-term recovery or the gruesome downtrend would still continue.
Technical Analysis
By: Edris
The Daily Chart:
Looking at the daily chart, the correction has been halted over the last couple of weeks above the $16K support level.
Regardless, bullish momentum is still lacking, and the price has failed to retest the $18K level....
Read More »
CryptoVizArt
November 18, 2022
Bitcoin (BTC), Crypto news, Markets
It’s clear that the market remains fearful of potential contagion from the FTX fallout. As a result, market participants are offloading their assets from the exchanges, which might trigger the last phase of this bearish cycle’s capitulation.
Technical Analysis
By Shayan
The Daily Chart
The market has likely entered a new phase of short to mid-term consolidation as the price dropped significantly. Nevertheless, during the consolidation phase, the price might retest the...
Read More »
CryptoVizArt
November 13, 2022
Bitcoin (BTC), Crypto news, Markets
Market participants are going through a period of fear and uncertainty as the FTX exchange has recently announced bankruptcy after facing a massive liquidity crunch. As a result, Bitcoin plunged and marked a new low at $15.5K.
Technical Analysis
By Shayan
The Daily Chart
The $18K level had been supporting the price for several months. However, Bitcoin was recently rejected and experienced a massive shakeout, plunging beneath it following massive bearish momentum.
The market...
Read More »
CryptoVizArt
November 7, 2022
Bitcoin (BTC), Crypto news, Markets
Bitcoin has finally surpassed the 100-day moving average, which has been the most powerful resistance to the price for the last five months. After a short-term period of consolidation, the cryptocurrency went through another spike, returning the bullish sentiment to the market.
However, Bitcoin is soon to confirm a bullish trend reversal as the price has reached a significant resistance region and marked multiple bearish signs in lower timeframes.
Technical Analysis
By...
Read More »
CryptoVizArt
November 6, 2022
Bitcoin (BTC), Crypto news
After recording its highest daily close since September, breaking above the 100-day moving average line, Bitcoin’s price eyes higher targets.
Technical Analysis
Technical Analysis By: Edris
The Daily Chart
On the daily timeframe, the price just broke above the 100-day moving average resistance line after multiple rejections during the last couple of weeks. this is the first time it succeeds since September, and if the price holds another day above it – it will become the...
Read More »
CryptoVizArt
November 3, 2022
Bitcoin (BTC), Crypto news, Markets
Bitcoin’s short-term price action is still hanging in the balance, as it is currently consolidating in a key area. The next few days could determine whether the recent rally was really the beginning of a new bull market or just another bull trap.
Technical Analysis
By: Edris
The Daily Chart
On the daily timeframe, after breaking above the long-term bearish trendline and retesting both the trendline and $18K, the price has been trapped between two significant dynamic levels;...
Read More »