CryptoVizArt
November 1, 2022
Bitcoin (BTC), Crypto news
Bitcoin is struggling to continue the recent rally, as the price has been retracing over the last few days. However, considering the significant support levels available, the short-term future is still looking bright for the bulls.
Technical Analysis
Technical Analysis By: Edris
The Daily Chart:
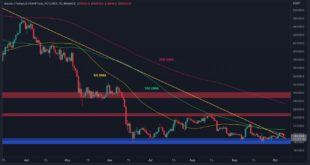
Looking at the daily timeframe, the last week’s rally has come to a halt, as the price is yet to break above the $21K mark. The 100-day moving average is currently acting as an...
Read More »
CryptoVizArt
October 30, 2022
Bitcoin (BTC), Crypto news, Markets
After getting rejected by the mid-term descending trendline for several months, Bitcoin finally broke above this obstacle and now attempting to surpass the 100-day moving average line.
However, the momentum hasn’t turned bullish yet, whereas BTC had formed a bearish reversal pattern in the lower timeframes. As of yet, there is no sign of a trend reversal in the price action.
Technical Analysis
By Shayan
The Daily Chart
Bitcoin has formed a bearish triangle pattern and found...
Read More »
CryptoVizArt
October 27, 2022
Bitcoin (BTC), Crypto news, Markets
Bitcoin’s bullish momentum is strong over the past couple of days, as the price has broken another significant dynamic resistance level to the upside. However, there is still work to do in order for the trend to be considered positive.
Technical Analysis
By: Edris
The Daily Chart
On the daily timeframe, the price has finally broken above the 50-day moving average after rebounding from the $18K support level. The broken bearish trendline has also acted as support, pushing BTC...
Read More »
CryptoVizArt
October 19, 2022
Bitcoin (BTC), Crypto news
Bitcoin’s price continues to trade sideways as no big movements in either direction have taken place. As of this writing, the $18K and $20K levels are yet to be broken.
Technical Analysis
By: Edris
The Daily Chart
On the daily timeframe, the price recently retested the broken, bearish trendline and the $18K support level. These levels provided enough support to prevent another dip toward lower prices. However, the 50-day moving average located at around $19K is persisting as...
Read More »
CryptoVizArt
October 16, 2022
Bitcoin (BTC), Crypto news, Markets
Bitcoin’s price has been trapped inside a consolidation range between $18K and $25K for months already, and is trading sideways with extremely low volatility. However, the primary cryptocurrency is now closer to the lower boundary of the range around $18K, and if this level breaks, we can expect new yearly lows.
Technical Analysis
By Shayan
The Daily Chart
The following chart indicates that the market suffers from insufficient activity and a lack of demand. As a result, the...
Read More »
CryptoVizArt
October 13, 2022
Bitcoin (BTC), Crypto news, Markets
Today, BTC went through some massive volatility. Accordingly, the trading volume on Binance increased exponentially. The price is struggling to hold above the $18K level, and the potential for further correction is causing fear across the market.
Technical Analysis
By Grizzly
The Daily Chart:
On the daily chart, Bitcoin is trading slightly above $18K, one of the lowest levels since the market crash in June. Throughout this period, this crucial level (in yellow) has been...
Read More »
CryptoVizArt
October 10, 2022
Bitcoin (BTC), Crypto news, Markets
The crypto market continues to go through a phase of uncertainty and low volatility alongside steady price action. Currently, Bitcoin is trapped in a range, and the direction it takes to break away from it would determine the cryptocurrency’s mid-term direction.
Technical Analysis
By Shayan
The Daily Chart
Despite the descending multi-month trendline acting as significant resistance, the price has broken through and formed a pullback. However, at this moment, the bullish...
Read More »
CryptoVizArt
October 8, 2022
Bitcoin (BTC), Crypto news
Just as Bitcoin began to show some bullish potential for a possible trend reversal, the price got rejected from the significant resistance level of $20K.
BTC is in a crucial zone, as the price action in the next few days could determine the short-term to the mid-term trend.
Technical Analysis
By: Edris
The Daily Chart
The bitcoin price recently rebounded from the $18K support level and broke above the significant bearish trendline that started forming when BTC touched the...
Read More »
CryptoVizArt
October 6, 2022
Bitcoin (BTC), Crypto news, Markets
The market is currently attempting a recovery that might take the price up to $22K after being supported by the critical $18K level. However, there is significant resistance at around $20K. The bearish phase appears far from over as the substantial lack of demand in the market continues.
Technical Analysis
By Shayan
The Daily Chart
The descending multi-week trendline (currently at $20.5K) has been acting as significant resistance to the price for the past five months....
Read More »
CryptoVizArt
October 2, 2022
Bitcoin (BTC), Crypto news
Bitcoin has yet to make a decisive move in any direction as the primary cryptocurrency continues to wrestle with the $18K support level. A bearish breakout below this position could be disastrous.
Technical Analysis
By: Edris
The Daily Chart
Bitcoin’s price overlaps with crucial support on the daily timeframe, as it oscillates in a very tight range between the significant descending trendline and the $18K support level. With minimal wiggle room between these levels, a...
Read More »