Felix Mollen
February 15, 2023
Uncategorized
On February 14, 2023, The Los Angeles County Museum of Art (LACMA) announced that it received the first and largest donation of NFT art ever sent to an American museum.
According to LACMA’s statement, the donation of 22 digital artworks was made by the collector Cozomo de’ Medici. The collection includes works by international artists from Brazil, Canada, China, England, Germany, Portugal, and the United States.
Some of the NFTs donated to LACMA. Image: LACMAAmong the donated...
Read More »
CryptoVizArt
February 12, 2023
Bitcoin (BTC), Crypto news, Markets
Bitcoin’s recent rally has improved the overall sentiment among market participants. This change of scene has spurred a positive momentum across the industry as signs of a bull market start popping.
Technical Analysis
By Shayan
The Daily Chart
The $25K price region has been the most significant barrier in Bitcoin’s path during the last eight months. Most recently, the price attempted to surpass this level and failed, resulting in a consolidation correction stage.
However,...
Read More »
CryptoVizArt
February 9, 2023
Bitcoin (BTC), Crypto news, Markets
The market has struggled to push above the significant resistance level of $25K, and now the price is slowly declining. Therefore, the possibility of a correction before the next rally has increased.
Technical Analysis
By Shayan
The Daily Chart
The $24K-$25K region is currently providing the most significant resistance for Bitcoin on the daily timeframe. It’s also a vital psychological level, as it has been the main barrier during the last eight months.
However, due to the...
Read More »
CryptoVizArt
February 6, 2023
Bitcoin (BTC), Crypto news, Markets
Bitcoin’s price rally has come to a halt as the market has been consolidating below a significant resistance level for weeks. While there are some worrying technical signs in the short term, a very bullish signal is also developing.
Technical Analysis
By: Edris
The Daily Chart
On the daily timeframe, the price has been consolidating below the $25K resistance area as of late. Recent daily candles suggest the bullish momentum is fading. The RSI also confirms this, as it has...
Read More »
CryptoVizArt
January 30, 2023
Bitcoin (BTC), Crypto news, Markets
Over the last week, Bitcoin has seen many bullish on-chain and technical signals. However, reaching a significant resistance level at $24K, there has been a battle between the bulls and the bears. The main question is whether it is the beginning of a bull market or just a bull trap.
Technical Analysis
By Shayan
The Daily Chart
Bitcoin’s impulsive uptrend has been halted by the psychologically significant resistance level of $24K. Meanwhile, the price has entered a...
Read More »
CryptoVizArt
January 25, 2023
Bitcoin (BTC), Crypto news, Markets
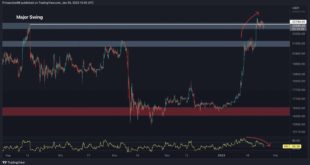
Bitcoin’s recent uptrend has paused temporarily upon arriving at the major swing level of roughly $22.8K. Although there are some bullish signs based on the on-chain analysis, there is a significant resistance region ahead in Bitcoin’s path.
Technical Analysis
By Shayan
The Daily Chart
The market appears to be looking for direction as the price has now reached a critical resistance zone. The descending trendline had been supporting the price until Bitcoin experienced a sudden...
Read More »
CryptoVizArt
January 22, 2023
Bitcoin (BTC), Crypto news, Markets
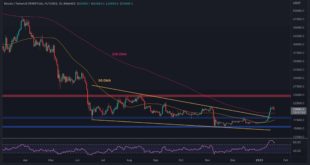
Bitcoin has initiated an explosive rally after finding support amid the $16K price level. Since then, BTC surpassed the 100-day and 200-day moving averages at $18K and $19.6K.
After a prolonged downtrend, the price breaking above the 200-day moving average is a substantial bullish sign for the market. If the bulls maintain the MA-200 level, adequate demand will likely return to the market, and the sentiment will continue in the short term.
However, there is an evident bearish...
Read More »
CryptoVizArt
January 19, 2023
Bitcoin (BTC), Crypto news, Markets
With Bitcoin’s recent price rally, many assume that the bear market is over. But is it too early to call bottoms?
Technical Analysis
By: Edris
The Daily Chart:
On the daily timeframe, the price has been rallying over the past couple of weeks, breaking above multiple static resistance levels and the significant 200-day moving average. The large falling wedge pattern has also been broken to the upside, which is usually considered a bullish reversal signal.
From a classical...
Read More »
CryptoVizArt
January 16, 2023
Bitcoin (BTC), Crypto news, Markets
Bitcoin’s price has gained significant bullish momentum and recovered from the drop caused by the FTX fallout. Yet, it has reached a robust resistance, and if the bulls push the price above it, a mid-term uptrend will become possible.
Technical Analysis
By Shayan
The Daily Chart
Bitcoin’s price continued its rally after overtaking the 50 and 100-day moving averages. It has also surpassed the wedge’s upper trendline reaching a decisive resistance level with considerable...
Read More »
CryptoVizArt
January 13, 2023
Bitcoin (BTC), Crypto news
Bitcoin’s price has finally broken above a significant resistance level following yesterday’s CPI announcement. However, there is still one major obstacle that should be taken out for the price action to be considered bullish.
Technical Analysis
By: Edris
The Daily Chart:
On the daily timeframe, the price has finally broken above both the $18K resistance level and the higher boundary of the large falling wedge pattern. From a classical price action point of view, BTC could...
Read More »