Litecoin is slowly moving higher from the .50 support against the US Dollar. LTC price is now trading above and the 55 simple moving average (4 hours). There was a break above a key bearish trend line with resistance near .80 on the 4-hour chart of the LTC/USD pair (data feed from Coinbase). The pair could gain bullish momentum if it clears the .20 and .80 resistance levels. Litecoin price is recovering from the .50 zone against the US Dollar, similar to Bitcoin. LTC price could climb again if there is a clear move above .80. Litecoin Price Analysis In the past few sessions, there was a decent increase in Bitcoin, Ethereum, Ripple, and Litecoin against the US Dollar. Earlier, LTC formed a base above the .00 level. The price started a
Topics:
Aayush Jindal considers the following as important: Altcoin News, LTC, News, Trading
This could be interesting, too:
Bitcoin Schweiz News writes Litecoin jetzt in der Telegram-Wallet verfügbar!
Bitcoin Schweiz News writes Meme Coins frühzeitig entdecken: So gelingt der Einstieg vor dem Hype
Bitcoin Schweiz News writes Bitpanda vs. Binance: Welche Bitcoin-App ist die beste für die Schweiz?
Bilal Hassan writes Morocco Cracks Down on Crypto Property Deals
- Litecoin is slowly moving higher from the $57.50 support against the US Dollar.
- LTC price is now trading above $60 and the 55 simple moving average (4 hours).
- There was a break above a key bearish trend line with resistance near $60.80 on the 4-hour chart of the LTC/USD pair (data feed from Coinbase).
- The pair could gain bullish momentum if it clears the $64.20 and $65.80 resistance levels.
Litecoin price is recovering from the $57.50 zone against the US Dollar, similar to Bitcoin. LTC price could climb again if there is a clear move above $65.80.
Litecoin Price Analysis
In the past few sessions, there was a decent increase in Bitcoin, Ethereum, Ripple, and Litecoin against the US Dollar. Earlier, LTC formed a base above the $57.00 level.
The price started a recovery wave above the $58.50 and $60.00 levels. It broke the 23.6% Fib retracement level of the downward move from the $70.68 swing high to the $57.64 low. There was a break above a key bearish trend line with resistance near $60.80 on the 4-hour chart of the LTC/USD pair.
Litecoin is now trading above $60 and the 55 simple moving average (4 hours). On the upside, the price is facing resistance near the $64.20 level. It is close to the 50% Fib retracement level of the downward move from the $70.68 swing high to the $57.64 low.
The first major resistance is near the $65.80 level. A clear move above the $65.80 level could push the price toward the $68 zone. The next major resistance sits near the $70 level. Any more gains might send the price toward the $75 level.
On the downside, initial support is near the $60.20 level. The next major support is near the $57.50 level. If there is a downside break below the $57.50 support, the price could accelerate lower toward the $53.20 level in the near term.
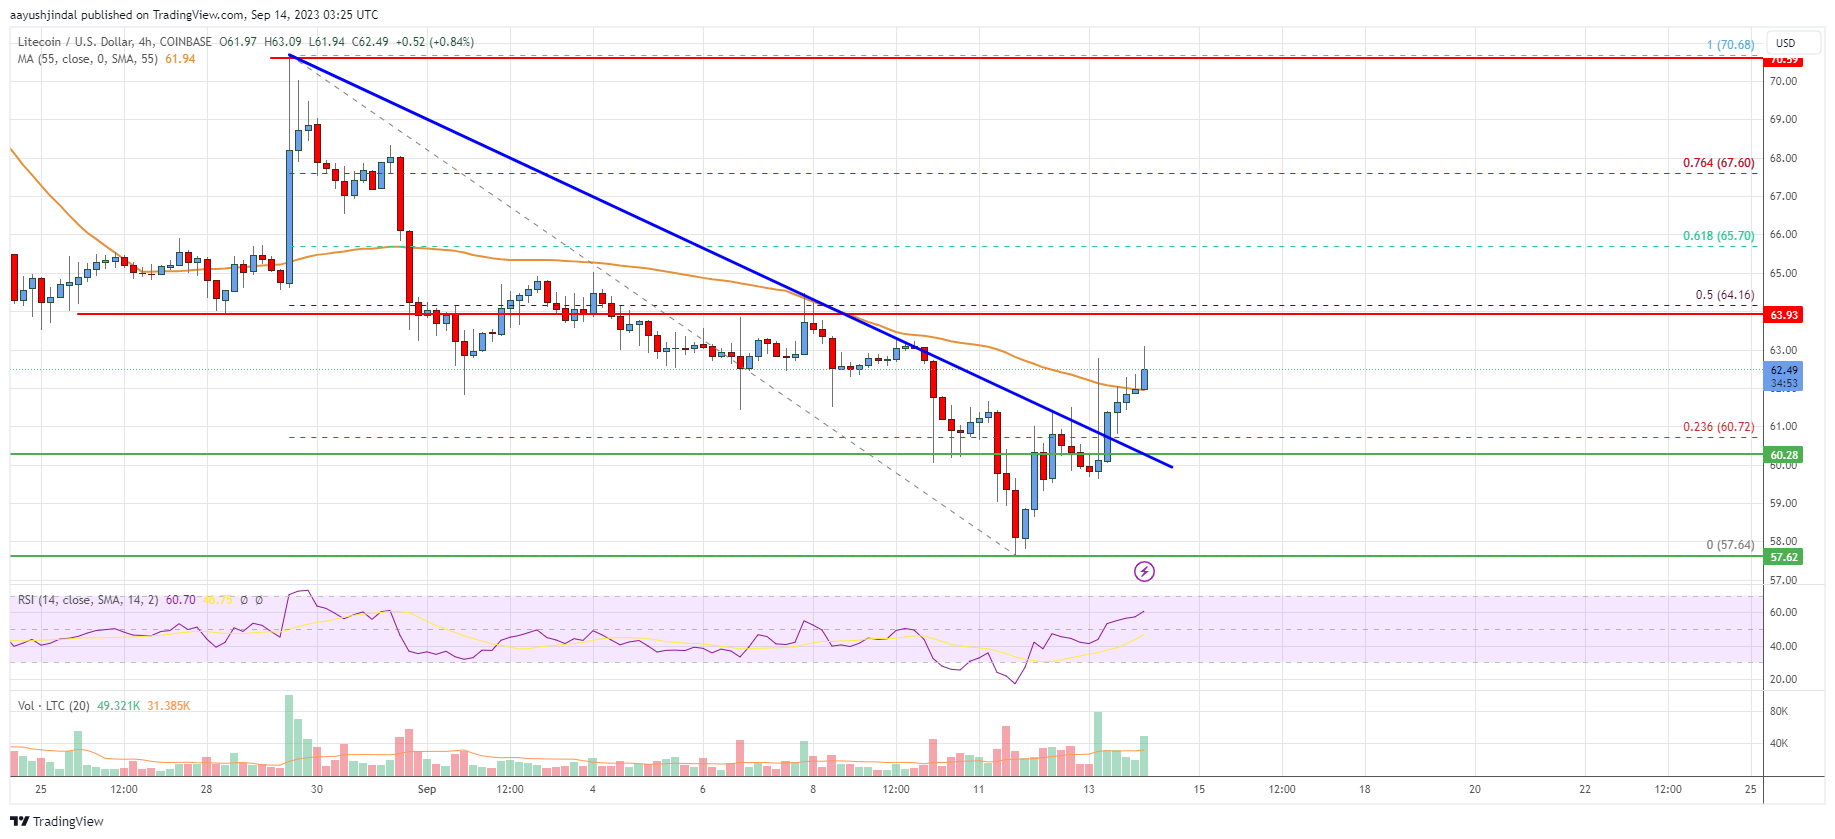
Looking at the chart, Litecoin’s price is trading above $60 and the 55 simple moving average (4 hours). Overall, the price could gain bullish momentum if it clears the $64.20 and $65.80 resistance levels.
Technical indicators
4 hours MACD – The MACD for LTC/USD is now gaining pace in the bullish zone.
4 hours RSI (Relative Strength Index) – The RSI for LTC/USD is now above the 50 level.
Key Support Levels – $60.20 and $57.50.
Key Resistance Levels – $64.20 and $65.80.