CryptoVizArt
March 3, 2023
Crypto news, Markets, Ripple (XRP), Tether (USDT)
Ripple’s price has been declining over the last few weeks, with two significant moving average lines broken to the downside. The price could drop deeper in the coming days, as things are not looking good from a technical analysis aspect.
Technical Analysis
By: Edris
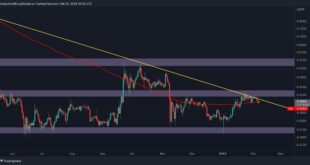
XRP/USDT Daily Chart
Looking at the USDT chart, the price has been rejected from the significant $0.43 area and has broken both the 50-day and 200-day moving average lines to the downside, which are both located...
Read More »
CryptoVizArt
February 28, 2023
Crypto news, Ripple (XRP)
Ripple’s price has remained dormant over the last couple of days, trading within the narrow range of $0.42 and $0.31 and struggling to break out. A slight decline towards the lower end of the range seems likely, given that the cryptocurrency was recently rejected at a crucial resistance level.
Technical Analysis
By Shayan
The Daily Chart
Ripple’s price has shown signs of weakness, printing small candles with no specific direction. Most recently, the price attempted to claim...
Read More »
CryptoVizArt
February 22, 2023
Bitcoin (BTC), Crypto news, Ripple (XRP), Tether (USDT)
Ripple’s price has been consolidating in a tight range against the USD. However, against BTC, it has yet to manifest a significant move.
Technical Analysis
By: Edris
XRP/USDT Daily Chart
The price failed to break above the $0.43 resistance level and has been trapped in a tight range between the 50-day and 200-day moving average lines, located around the $0.38 and $0.4 levels, respectively.
A breakout to the upside would likely lead to another test of the $0.43 level, with the...
Read More »
CryptoVizArt
February 19, 2023
Bitcoin (BTC), Crypto news, Ripple (XRP), Tether (USDT)
Ripple’s price action has been far from convincing lately, as the cryptocurrency has been rejected from a key resistance level against the USD. XRP is also in a downtrend on the BTC paired chart, making things worse.
Technical Analysis
By: Edris
XRP/USDT Daily Chart:
On the XRPUSDT chart’s daily timeframe, the price has been rejected from the $0.43 level multiple times and is currently oscillating between the 200-day and 50-day moving averages located around $0.395 and $0.385...
Read More »
Duo Nine
February 17, 2023
Crypto news, Ethereum (ETH), Ripple (XRP)
This week, we take a closer look at Ethereum, Ripple, Cardano, Polygon, and OKB.
Ethereum (ETH)
Ethereum had a great rally this past week but failed to break above the key resistance at $1,660. Nevertheless, the price still managed to increase by 7.4%.
the current PA shows that buyers are becoming eager, and the key resistance is being tested again and again. The more this happens, the likelier it becomes for ETH to break above and move higher.
Looking ahead, ETH has good...
Read More »
CryptoVizArt
February 14, 2023
Crypto news, Ripple (XRP)
Ripple’s price has been trapped inside a static range between $0.42 and $0.31 and is struggling to break ou. A consolidation stage within this range could be imminent as the cryptocurrency was recently rejected from a vital resistance level.
Technical Analysis
By Shayan
The Weekly Chart
Since 2021, Ripple has been declining, forming a falling wedge pattern on the weekly timeframe. Recently, the price experienced a slight plummet after being rejected from the wedge’s upper...
Read More »
CryptoVizArt
February 7, 2023
Crypto news, Ripple (XRP)
Ripple’s price has struggled to break the significant descending trendline at $0.42 and is consolidating. However, it now faces the critical support level of the 200-day moving average.
Technical Analysis
By Shayan
The Daily Chart
Ripple’s price action has been dull after failing to surpass the $0.42 substantial resistance level, which also aligns with the descending trendline.
The price plummeted slightly and reached the 200-day moving average at $0.395. Therefore, the...
Read More »
CryptoVizArt
February 4, 2023
Bitcoin (BTC), Crypto news, Ripple (XRP), Tether (USDT)
XRP’s price has not yet shown any significant strength as it continues its struggle to surpass a critical resistance level over recent weeks. Things are not looking much better against BTC, with a major support level getting broken to the downside.
Technical Analysis
By: Edris
XRP/USDT Daily Chart
On the daily chart, the price has been consolidating in a tight range below the $0.43 resistance level for quite a while. The 200-day moving average, located around $0.4, has been...
Read More »
Duo Nine
February 3, 2023
Altcoins, Crypto news, Ethereum (ETH), Ripple (XRP)
This week, we take a closer look at Ethereum, Ripple, Cardano, Polygon, and Fantom.
Ethereum (ETH)
Ethereum, the second-largest cryptocurrency, continued to consolidate this week. The price only registered a 2.9% increase. This is because ETH is stuck in a channel between $1,670 and $1,550.
All attempts to break these levels were rejected in the past two weeks. While some altcoins were booking double digits gains (see Fantom below), Ethereum appears to be on a pause. This...
Read More »
CryptoVizArt
January 27, 2023
Bitcoin (BTC), Crypto news, Ripple (XRP), Tether (USDT)
Presently, XRP’s price action is not looking overly promising against either USDT or BTC. Things could worsen in the coming days if all remains as it is right now.
Technical Analysis
By: Edris
XRP/USDT Daily Chart
On the daily chart, the price continues its struggle to break above the $0.43 resistance level, following a push above both the 50-day and 200-day moving average lines.
In case the cryptocurrency finally moves beyond the aforementioned level, a rally toward the...
Read More »