The global crypto market has risen another $30 billion today, which has helped lift Bitcoin out of yesterday’s bearish descending triangle and onwards towards a new all-time high at $28,800.Despite the increase in investment entering the market over the last 24 hours, the overall trading volume has actually declined by $10 billion.This, coupled with the fact that there is a substantial RSI divergence on the Bitcoin price chart right now, suggests that the current bullish trend is weakening and that the leading cryptocurrency might correct soon.January has almost always been a bearish time for Bitcoin and the wider crypto market, particularly after the late 2017 rally. It’s plausible that the current rally could provide an attempt to pump up buying pressure, surpassing $30K, so that larger
Read More »Articles by Ollie Leech
Bitcoin Price Analysis: BTC Inside Descending Triangle – $24K or $28K Next?
December 29, 2020Bitcoin price has fallen under the psychological $27,000 level today and is now tracking inside a descending triangle pattern on the 4-hour chart.These patterns form when the price consolidates between a sloping resistance and flat support (yellow lines). It’s usually a signal that bearish momentum is increasing and that the flat support will be overcome soon.Breakouts from this pattern tend to be quite extensive and require strong supports to provide bullish traders with an opportunity to push back.$15 billion has left the global crypto market in the last 24 hours and Bitcoin dominance is back under the 70% mark.Price Levels to Watch in the Short-termOn the 4-hour BTC/USD chart, it’s clear that intraday selling pressure is increasing as BTC continues to print consecutive lower highs. The
Read More »Bitcoin Price Analysis: BTC Slides Sharply From $28K, Correction Time?
December 27, 2020Bitcoin is starting to correct from its rampant rise above $28K this week, with the current price down $1,900 from its recent peak of $28,420. With the Bitcoin market capital currently above $520 billion and overall dominance now above 71%, a correction has been on the cards for a number of days now.$55 million worth of BitMEX short positions have already been liquidated in the last few minutes, as fears of a reversal begin to disseminate.The $27,000 level appears to be providing some temporary intraday support right now as traders try to figure out if this is the start of the last major bitcoin correction we’ll see in 2020.Price Levels to Watch in the Short-termOn the 4-hour BTC/USD chart, we can see that the bitcoin downtrend was foreshadowed by a long-legged Doji forming on the chart
Read More »Bitcoin Price Analysis: Bulls Must Break This Level To Prevent A Bearish Double-Top
December 23, 2020Bitcoin bulls need to make sure the daily price closes above $23,850 today, or else a double top will form on the BTC/USD chart (see below).Double tops are bearish reversal setups that tend to result in strong downtrends. They form when an asset fails to breach the same resistance level twice in a short period of time. The second rejection signals to the market that bullish momentum has run out and that a shift in trend is about to occur.There’s also an obvious RSI divergence (yellow line) over the same timeframe, which supports the current trend weakening idea. Not to mention, $19 billion has departed from the market since 00:01 (GMT) today, as the Bitcoin dominance is breaking records.BTC Price Levels to Watch in the Short-termOn the 4-hour BTC/USD chart, we can see the price has failed
Read More »BTC Price Analysis: After Crashing $2K, Will Bitcoin’s Recent Recovery Hold?
December 21, 2020Bitcoin price has finally started to correct from its parabolic rally to new all-time highs. During the European trading session today, we saw the first hourly candle close beneath the support of the bearish rising wedge pattern (yellow lines), around 09:00 UTC.Rising wedges are classic bearish reversal patterns and typically result in strong corrections. This morning’s breakout signaled to the rest of the market that BTC was about to dive sharply and within minutes of the new candle starting, the bitcoin price tumbled over $980. The strong RSI divergence on Bitcoin’s chart (yellow line on RSI) was also a strong indication that the previous uptrend was weakening and that a correction was on the cards soon.$47 billion was wiped out during the peak of the reversal, according to Coinmarketcap
Read More »Bitcoin Price Analysis: How High Can The Parabolic Move Go? Is $25K In Sight?
December 17, 2020Bitcoin’s price has left everyone in shock today. Not only has the leading crypto broken the psychological $20,000 mark in the last 24 hours, but also the $21K, $22K, and $23K levels in rapid succession too.Over $71 billion has entered the global crypto market during this historical movement, pushing the weekly increase in worldwide crypto investment up to $119 billion.The dramatic surge in price has wiped out over 474 short positions on BitMEX worth a combined $131.4 million. This will have likely caused a majority of liquidated traders to buy back into BTC to recuperate losses, which in turn will have added to the already extremely high buying pressure.On the hourly BTC/USD chart, we can see that the RSI indicator and price action are beginning to bearishly diverge (yellow lines) which
Read More »As Bitcoin Breaks $20K – These Are The Next Possible Targets (BTC Price Analysis)
December 16, 2020Bitcoin price has just surged by $1,300 in the last few hours, taking it $780 beyond the previous all-time high of $19,990. This is the highest price Bitcoin has ever been across all exchange platforms and has happened just as the American trading session got underway.In the last analysis, we predicted that the prior drop in volatility could have been a sign of an early accumulation before a new big move, and it turns out this was exactly what was happening.$24 billion has flooded into the market during this latest price movement and pushed the global market capital within inches of $600 billion. This is the highest it’s been since January 30th, 2018 – over 1,052 days ago! This new uptrend has also caused a significant short squeeze and liquidated almost $400 million short positions on
Read More »BTC Consolidation Likely to End With a Huge Move: Bitcoin Price Analysis
December 15, 2020Bitcoin price has been oscillating within a narrow $450 range for the past 3 days now as bulls struggle to break over the 0.5 Fibonacci Extension level at $19,480. This area between $19,044 and $19,480 is the same spot that BTC was stuck inside of during December 5 – 8, right before prices tanked by $1,560.According to Bitcoin’s volatility chart (BVOL24H), the leading crypto has fallen by almost 43% since December 9th, and the global crypto market capital has also started pushing sideways. This could be construed as a sign of accumulation before another big move or that traders are simply winding down in the run-up to Christmas.Despite these factors, Bitcoin dominance is now up at 64.7%, and testing levels not seen in over 22 days.BTC.D chart via Tradingview.Price Levels to Watch in the
Read More »Bitcoin Price Analysis: BTC Facing Critical Resistance At $19,400
December 13, 2020Bitcoin has successfully bucked the bearish trend that’s been suppressing prices for the past 10 days, following a strong bullish RSI divergence breakout that we predicted in the previous analysis.After briefly dipping underneath the 200-MA on the 4-hour chart for the first time in over 60 days, strong buying momentum returned behind the asset and has since driven BTC up over $1,680 in under 48 hours.Over $40 billion has returned to the market since the trend reversal and has helped lift Bitcoin’s dominance back above a critical S/R level (green bar) on the BTC.D chart (see below). This is a healthy sign for Bitcoin and suggests more upside is likely in the short-term.Bitcoin Price Levels to Watch in the Short-termOn the 4-hour BTC/USD chart, we can see that the leading crypto has overcome
Read More »Bitcoin Price Analysis: BTC Retests Critical 2-Month Support, Will It Hold?
December 11, 2020Bitcoin price continues to slide away from $18,000 today and has now returned to the 4-hour 200 EMA line (red) for the first time since October 8th, 2020.Historically, this line has been a key long-term support for BTC and even though the leading crypto is inside the worrisome CME gap, it’s actually is getting a strong reaction from buyers right now.The global crypto market capital is now under the $525 billion mark, but there is an early sign that momentum could be about to flip bullish. On the RSI, we can see a bullish divergence (red lines + white arrows) between the RSI indicator line and current the price action. The former has printed a higher low back inside the index channel while the latter closed lower.Price Levels to Watch in the Short-termOn the 4-hour BTC/USD chart, we can see
Read More »Bitcoin Price Analysis: Will BTC Close The CME Gap Soon And Retest $17,000?
December 10, 2020Bitcoin bears have successfully taken back control of the asset this week and are now trying to secure a daily close beneath the $18K for the first time since this month. The global crypto market capital has been steadily declining over the last seven days and is now back below $540 billion.Right now, the leading crypto is tiptoeing on the edge of the $1,300 CME gap which sits just $25 below the current price and extends all the way down to $16,995. In order to fill this gap, bitcoin’s price will have to fall a further 6.95% which will almost certainly drag the rest of the alt market down with it.Price Levels to Watch in the Short-termOn the daily BTC/USD chart, we can see that the crypto-asset now appears to be tracking inside a large down-trending channel (light blue) after breaking
Read More »Following ATH: Here Are The Next Price Targets For Bitcoin (BTC Analysis)
November 30, 2020Bitcoin has just broken above its previous all-time high of $19,660 on Bitstamp exchange (white dashed line) and is now storming towards the psychological $20,000 level. This is a truly historical moment to behold and has taken the leading asset just under 3 years to fully recuperate the losses from the extreme 2018 bear market.New buying pressure from the US trading session is helping to maintain the surging momentum from this weekend, with the global crypto market capital now quickly approaching the $580 billion mark on Coinmarketcap.With Bitcoin now in price discovery, everyone is thinking the same thing. Where is BTC going now?Price to Levels to Watch in the Short-termOn the daily BTC/USD chart, we can see that prices are now surging towards the first set of new Fibonacci extension
Read More »Bitcoin Price Analysis: BTC Facing Huge Resistance Following Recovery, Will $18K Hold?
November 29, 2020Bitcoin bulls have successfully regained the $18,000 level today after breaking bullish from a pennant pattern formed yesterday – Saturday, November 28.Over the course of this weekend so far, $30 billion has returned to the global crypto market, which now stands at $540 billion. This has allowed the leading cryptocurrency to recover $1,900 of the $3,250 shed during the sharp correction between November 25-26.This speedy return of bullish momentum puts Bitcoin in a great position ahead of the return of US traders from their Thanksgiving hiatus, who will likely want to join in with buying up the dip.BTC Key Levels to Watch in the Short-termThe following 4-Hour BTC/USD chart shows that prices have run into a strong resistance zone (lowest red bar) between the 0.618 Fibonacci level at $18,240
Read More »BTC Price Analysis: Bitcoin’s Next Possible Targets If The Sharp Correction Continues
November 26, 2020Bitcoin price has crashed hard today in the wake of OKEx announcing the reopening of withdrawals one day earlier than initially scheduled.Hundreds of Chinese crypto miners who had been previously unable to cash out their BTC block rewards into fiat due to the exchange’s abrupt closure and the CCP’s clampdown on local OTC services are now supposedly dumping their BTC in droves.With it being Thanksgiving day today, too, not only does the timing of the reopening put US traders at a significant disadvantage, but it also means that any hope of a rebound during American trading hours later today is unlikely.$72 billion has been stripped from the global crypto market as a result of this event, and on the 4-Hour RSI, the leading crypto asset is now in the oversold region for the first time since
Read More »Can Bitcoin Break All-time High And Surpass $20K Very Soon? (BTC Price Analysis)
November 24, 2020Bitcoin price has managed to shake off fears of a correction today and is continuing to print new highs. During the start of the European trading session this morning between 08:00 -10:00 (UTC), BTC surged over $700 as a further $20 billion poured into the global crypto market.After hitting the first resistance at $19,100 – as mentioned in our last analysis – bulls are now pushing to overcome the next wall at $19,300 (as of writing these lines). If they’re successful here, Bitcoin’s all-time high price is just 2% away!BTC Price Levels to Watch in the Short-termWith Bitcoin now clear of the psychological $19,000 level, there are now just 3 main resistances standing in the way before prices return to the $19,660, which is the ATH level on Bitstamp. Above this level, BTC is in price
Read More »Bitcoin Price Analysis: Is Correction Inbound As Signs of BTC Overheating Appear?
November 23, 2020Bitcoin bulls have managed to buy up another dip today after prices slumped $650 during the morning’s early hours. This is the second significant price crash to have taken place over the last 48 hours, with BTC tumbling $1,000 yesterday to a low of $17,600 before correcting (marked by a white arrow on the following chart).According to popular crypto analyst Willy Woo, there has been a substantial spike in the number of ‘Bitcoin days destroyed’ recently. This refers to the number of bitcoins that are being moved and sold as opposed to being HODL’ed.When there’s a rise in the destruction of ‘Bitcoin days’ it likely signals that an increasing amount of long-term holders are dumping their coins onto the market. Woo says this could be construed as a warning that the Bitcoin market is
Read More »Bitcoin Price Analysis: BTC 5% Away From ATH, Breakout Soon?
November 20, 2020Bitcoin price continues its parabolic intraweek rally with a surging breakout from the bullish pennant we discussed in yesterday’s analysis. Since the opening of the traditional markets on Monday, BTC has risen by an eye-watering 17%.With the leading crypto asset now holding at around $18,700, it’s only 5% shy from getting back to its all-time high set on December 17, 2017 – 1,069 days ago.Looking at the global crypto picture, a further $21 billion has entered the market in the last 16 hours.Price Levels to Watch in the Short-termOn the 1-hour BTC/USD chart, we can see that the $18,800 level has created some intraday resistance as bullish traders eye the psychological $19K level above. This is the first wall bullish traders need to push through if the uptrend is to continue and is being
Read More »Bitcoin Price Analysis: BTC Consolidation – ATH or $16K Next?
November 19, 2020Bitcoin price is tracking inside a pennant pattern right now as candle wicks pinch between two trend lines (yellow). This is a classic bullish continuation pattern and usually results in a strong breakout once the asset reaches maximum consolidation.According to new figures from Skew, the statistical likelihood of Bitcoin’s price ending the year higher than $20,000 – it’s current all-time high – now stands above 25%.Despite this optimism, however, short-term volatility has slackened right off during this period of consolidation. The global crypto market capital has been holding steady around $500 billion for the last 3 days. Will we see another surging rally start soon?Price Levels to Watch in the Short-term.On the 1-hour BTC/USD chart, we can see that the leading cryptocurrency is
Read More »Bitcoin Price Goes on Insane Rally Beyond $17,000: Here’s Why and What’s Next
November 17, 2020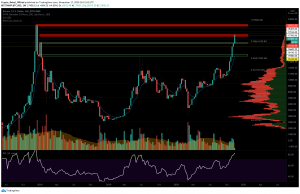
Bitcoin price has erupted through the psychological $17,000 level today. It is now breaking through the first high set way back in January 2018, after the primary cryptocurrency crashed from its all-time high level of nearly $20K. This is the first time Bitcoin has been above the $17,200 mark in 1,066 days.
Over the last 40 hours, $32 billion has flooded back into the crypto markets – according to data by CoinGecko. It’s been speculated that one of the main catalysts for this explosive Bitcoin rally is that Chinese crypto miners have struggled to exchange their BTC block rewards for fiat currency due to the ongoing complications with OKEx and the CCP clamping down on other local brokers.
Thus, the Bitcoin market has had significantly less selling pressure from miners,
Bitcoin Price Analysis: BTC Tests Critical Support, Correction To $15K Incoming?
November 15, 2020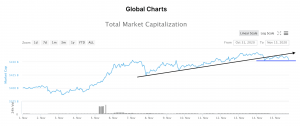
Bitcoin’s price is now back on the key S/R zone (top green bar) between $15,900 and $15,860, as low weekend trading volume puts the brakes on bullish momentum.
Since setting a new high of $16,475 on November 13, the leading crypto has printed 4 consecutive lower highs over the 4-hour time frame and is now tracking in a downtrending channel (blue channel).
Global Crypto Market Capital chart by CoinmarketcapThe global crypto market capital has also broken away from its up-trending line (black), which has now flipped into a resistance and is even close to retesting the recent low at $452 billion (blue line). Printing a new lower low beneath this would signal a new bearish trend over the crypto market that could result in more downside to come during the week ahead.
Price
Bitcoin Price Sets New High Above $16,100 – Is Macro Cycle Confirmed? (BTC Analysis)
November 12, 2020
Bitcoin bulls have returned with force today and propelled the top crypto to a new high of $16,177 – a price not seen since 2017! The global crypto market briefly rose back above $460 billion during the surge as $12 billion flooded back into the space.
Despite strong selling pressure at this new level, optimism is high from other industry-leading traders that Bitcoin has officially entered a new macro-cycle. According to the creator of the popular Bitcoin Stock-to-Flow model, PlanB, this latest pump above the $16,000 threshold means BTC is still on track to reach $100,000 per coin.
Price Levels to Watch in the Short-term
On the 4-hour BTC/USD chart, we can see that the asset has broken out of the bullish ascending triangle and is currently throwing back onto the former
Bitcoin Price Analysis: 3 Bearish Signs Suggest $14.6K Retest is Coming
November 10, 2020
Bitcoin is currently resting along the support of what appears to be an early ascending triangle. Although this pattern is typically a bullish continuation formation, there are 3 concerning factors that suggest BTC prices are about to tumble.
(1) There’s substantial divergence on the 4-hour RSI that indicates the current trend is particularly weak (yellow line on indicator).
(2) Prices are now pushing sideways after yesterday’s failed attempt to close above the former close high at $15,800. Low volatility usually signifies a lack of confidence in the market and precedes a bearish trend reversal.
(3) The global crypto market capital is still stagnating around the $440 billion mark, which supports the theory that bulls are exhausted.
Price Levels to Watch in the Short-term
Bitcoin Price Analysis: BTC Tries to Reclaim $15K, Has the Dip Been Bought?
November 8, 2020
Bitcoin bulls have managed to regain some of the lost ground from the heavy 10% correction that took place between Friday and Saturday, November 6-7.
The crash coincided with BTC failing to break above the psychological $16,000 – a level not seen January 8, 2018 – and the heated 2020 US Presidential election drawing to a close.
Looking at the following 4-hour chart, we can see that a very subtle divergence on the RSI (red lines) showed the surging uptrend was weakening and accurately foreshadowed Bitcoin’s bearish reversal.
On the global market capital chart, we can also see that investment entering the crypto market in the last 15 hours has flattened significantly and is ranging around $435 billion. This suggests there is still a great deal of uncertainty in the current
Bitcoin Price Surges Towards $15K, How High Can The Parabolic Rally Reach? (BTC Analysis)
November 5, 2020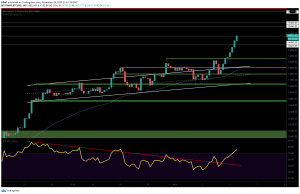
Bitcoin price continues to break new grounds today as bulls prepare to take on the $14,900 resistance. Since the bottom of the brief dip yesterday at 08:00 UTC, $24 billion has been added to the market with most of it being piled into BTC.
Bitcoin dominance has now broken over 65.0% for the first time since June, which shows there’s currently little interest in altcoins at this moment in time. Even some of the typically strong performing DeFi tokens such as Yearn.finance (YFI) and Dai (DAI) are in the red today, down 7.89% and 0.04% respectively.
It’s also worth noting that November tends to be one of the best seasonal times for Bitcoin, according to data collected by Willy Woo, and is profitable over 70% of the time.
Price Levels to Watch in the Short-term
On the 4-hour
Bitcoin $600 Below Saturday’s 2020 High, Retest Incoming? (BTC Analysis)
November 2, 2020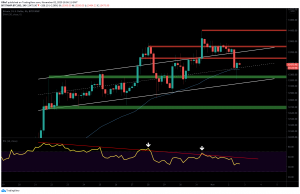
Bitcoin bulls have managed to regain the $13.4K support today after prices crashed 3.7% in 4 hours.
Uncertainty in the stock markets and the upcoming US presidential elections could have played a role in today’s crypto market activity, as larger traders tend to withdraw into more stable assets ahead of significant global events.
$12 billion has exited the markets during the latest sell-off along with a $14 million long squeeze.
Price Levels to Watch in the Short-term
On the 4-hour BTC/USD chart, we can see that the price action is now back inside the rising channel pattern after failing to find new support on the former resistance.
During the latest 4-hour close, we can see that BTC buyers were successful in recovering to the median line (white dashed line), which is also
Bitcoin Price Hits 1000-Day High, New Bull Cycle Inbound?
October 31, 2020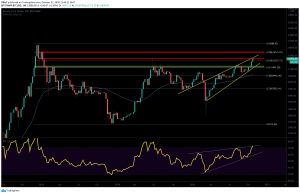
Bitcoin price has broken over $14,100 for the first time since January 15, 2018 – a staggering 1,020 days ago. The move has coincided with the 12-year anniversary of the first release of the Bitcoin whitepaper and $7 billion flooding back into the market during the start of the US trading session.
Is this the start of the new bull cycle PlanB has been predicting that will propel BTC prices to over $100,000 per coin?
Price Levels to Watch in the Short-term
On the 4-hour BTC/USD chart, we can see that bullish traders are battling hard right now to defend $13,900 after selling pressure at the psychological $14K sent bitcoin’s price tumbling.
Just underneath, there is a new flipped level at the former YTD-high ($13,800), which should provide some intraday support if prices
Bitcoin Price Analysis: BTC Crashes Under Major Resistance, Will $13K Hold?
October 28, 2020Bitcoin bulls are trying to regain lost ground after failing to break the high set back on June 26, 2019, at $13,880.
This would’ve been the highest price Bitcoin has reached in over 490 days, however, heavy selling pressure and a weakening uptrend caused prices to tank over 7% in under 12 hours. Right now, the leading crypto is back inside a rising channel pattern and stuck under the median line resistance (white dashed middle line on the following chart).
Over $17 billion has been stripped from the crypto market since yesterday’s steep correction but overall the global market capitalization is still printing higher lows – according to data by CoinGecko. This is a promising sign and implies that overall sentiment is still favorably bullish.
BTC Price Levels to Watch in
Bitcoin Sets New 2020 High: What Are The Next Targets? BTC Analysis & Overview
October 27, 2020Bitcoin bulls are staging a new breakout attempt right now as prices surge above the 0.618 Fibonacci level around $13,360 for the second time in 48 hours. The price wicked to $13,500, setting a fresh high for 2020.
This is a critically important time for Bitcoin, as a second failure to overcome this level could form a bearish double top and cause prices to plummet.
Looking at the global crypto market capital, we can see that volumes are now back to Sunday levels at $397 billion after yesterday’s $12 billion decline. However, we would like to see a higher high preferably above $400 billion to confirm a new bullish phase has started.
Price Levels to Watch in the Short-term
On the 1-hour BTC/USD chart, we can see that the price action is tracking inside of a bullish flag
BTC Price Analysis: Bitcoin Weakens As Wall Street In Deep Red, Is $14K Target Intact?
October 26, 2020Bitcoin’s price remains stuck under the key 0.618 Fibonacci level at $13,360 going into this week after little bullish momentum arrived during the opening of the US traditional markets. Wall Street, meanwhile, is painted in red.
Over shorter timeframes, it’s clear that the general sentiment is still bullish as the leading asset continues to print higher lows. However, trading volumes are beginning to decline, and there’s a growing divergence between the RSI and price action, which suggests things may turn bearish soon.
Since the Paypal news broke on October 21, over $33 billion has flooded back into the crypto space and helped the leading asset’s market dominance break back over 61% for the first time since August 2, 2020.
Price Levels to Watch in the Short-term
On the
BTC Price Analysis: After Breaking 2020 High, Is Bitcoin Eyeing $14K?
October 22, 2020Bitcoin price has managed to avoid all 3 unfilled CME gaps this week and go on to break the $13,235 level for the first time since July 10, 2019 – 469 days ago.
The catalyst for the 11% surge was the breaking news from PayPal yesterday that the payments giant will soon facilitate BTC and other crypto-asset payments.
According to data from Datamish, the Paypal rally caused a $70.8M short squeeze on BitMEX as an eye-popping $31 billion returned to the crypto market during yesterday’s frenzy. This will have undoubtedly helped catapult prices beyond the milestone $12K and $13K levels as short traders buy back into BTC to cover losses.
Price Levels to Watch in the Short-Term
On the weekly BTC/USD chart, we can see that prices fell just shy of the 0.618 Fibonacci resistance at